


A new analysis shows that Bitcoin (BTC) may be on the verge of a calculated price crash that could take it below $107,000 before igniting the next bullish rally. The cryptocurrency market structure currently reflects a short-term bearish correction within a broader bullish trend, supporting the likelihood of a potential surge to new all-time highs soon.
Bitcoin Prepares For Final Dip Below $107,000
Crypto market expert, Tehi Thomas, in a recent TradingView post, suggested that Bitcoin’s current structure may be entering its final corrective phase. The analyst points to a potential price crash below the $107,000 level as part of a strategic play by smart money.
Related Reading
The analyst shared a chart showing Bitcoin forming consecutive lower highs while its price presses downwards. Across these highs, the market is also respecting a descending trendline, a pattern which often indicates short-term bearish pressure. Notably, this trendline appears to be serving as a potential trap designed to engineer a liquidity grab and discount entry.
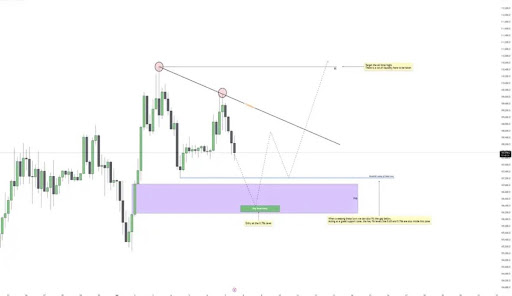
Thomas notes that once the key zone and sell-side liquidity area around $107,800 is taken, Bitcoin’s price is expected to dip into a nearby Fair Value Gap (FVG), extending down to the $106,500-$106,200 region. This FVG overlaps with critical Fibonacci levels, particularly the 0.786 retracement near $106,200, strengthening the confluence for a potential reversal point.
Thomas has highlighted this $106,200 level as a high-probability buy zone, where institutions may re-enter the market. Notably, the analyst’s anticipated price correction for Bitcoin is not seen as a breakdown of structure or market failure, but rather a calculated liquidity grab to fill inefficiencies left from the previous lag. As long as the price respects the $106,000 range and displays bullish order flow afterward, its projected correction is expected to complete the accumulation phase.
All-Time Highs In Sight After Key Reversal
Following Bitcoin’s projected sweep and fill of the FVG, the cryptocurrency is expected to form a reversal structure that could kick off the next major rally. Despite the projected crash below $107,000, Thomas asserts that Bitcoin’s overall macro trend remains bullish. Moreover, this short-term pullback is considered a setup for a much larger move toward a new all-time high.
Related Reading
Thomas’s chart marks the $110,500 zone as the final magnet and ATH target, with a significant layer of untapped liquidity above it. The analyst’s thesis is that once the sell-side pressure is exhausted and displacement confirms the shift in direction, Bitcoin could once again regain bullish momentum.
Furthermore, the TradingView expert has pointed out that the FVG near $106,200 acts as both a liquidity magnet and a springboard, set to launch the flagship cryptocurrency into price discovery mode once again. Currently, Bitcoin is trading at $108,744, meaning a potential surge to the projected ATH level at $110,500 will represent a 1.61% increase.
Featured image from Pixabay, chart from Tradingview.com