Close Menu
  • Home
  • AI & Technology
  • Politics
  • Business
  • Cryptocurrency
  • Sports
  • Finance
  • Fitness
  • Gadgets
  • World
  • Marketing

Subscribe to Updates

Subscribe to our newsletter and never miss our latest news

Subscribe my Newsletter for New Posts & tips Let's stay updated!

What's Hot

Dogecoin Trap Shows A Major Crash, But How Low Will The Price Go?

April 27, 2026

Why The 42% Crash From ATH Is Actually Good For Bitcoin And The Crypto Market

April 27, 2026

Planning for Trump’s security during big events may get trickier

April 27, 2026
Facebook X (Twitter) Instagram
  • Home
  • About US
  • Advertise
  • Contact US
  • DMCA
  • Privacy Policy
  • Terms & Conditions
Facebook X (Twitter) Instagram
MNK NewsMNK News
  • Home
  • AI & Technology
  • Politics
  • Business
  • Cryptocurrency
  • Sports
  • Finance
  • Fitness
  • Gadgets
  • World
  • Marketing
MNK NewsMNK News
Home » Ethereum Approaches Wyckoff ‘Liftoff’ Phase
Cryptocurrency

Ethereum Approaches Wyckoff ‘Liftoff’ Phase

MNK NewsBy MNK NewsJuly 4, 2025No Comments3 Mins Read
Facebook Twitter Pinterest LinkedIn Tumblr Email
Share
Facebook Twitter LinkedIn Pinterest Email


Ethereum (ETH) is up 4.2% over the past seven days, trading in the mid-$2,500 range at the time of writing. Although the digital asset remains down 19% on a year-over-year (YoY) basis, some analysts are optimistic that it’s ready for a liftoff.

Ethereum Enters Wyckoff ‘Liftoff’ Phase

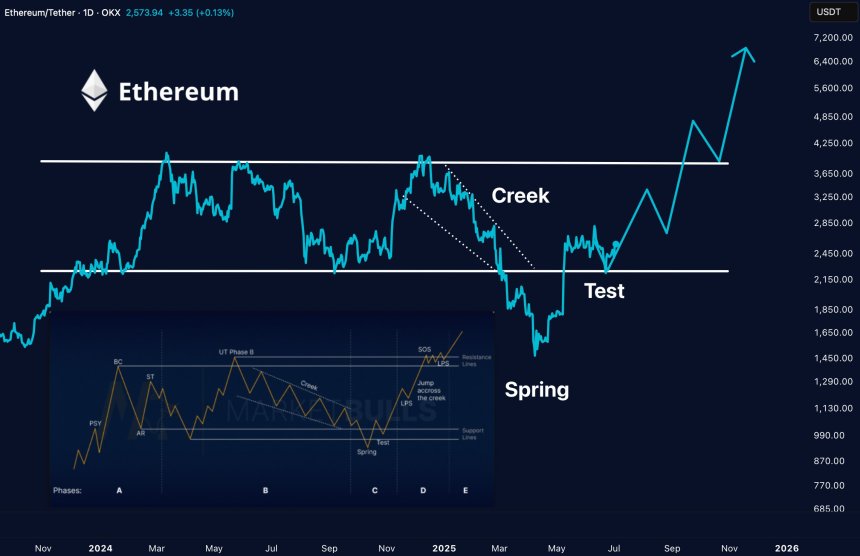
In an X post published today, crypto trader Merlijn The Trader noted that Ethereum appears to be following the Wyckoff Accumulation pattern and has successfully cleared both the ‘creek’ and ‘spring’ phases, potentially entering the ‘liftoff’ phase characterized by parabolic price action.

Related Reading

In the Wyckoff accumulation pattern, the ‘creek’ represents overhead resistance where price struggles to break higher, while the ‘spring’ is a false breakdown below support, meant to trap bears and confirm strong hands. The ‘liftoff’ phase follows the spring, marked by a sharp recovery and breakout above resistance, signaling the start of a new bullish trend.

The analyst shared the following Ethereum daily chart, which shows the cryptocurrency on the verge of a potential breakout, with its next major resistance at the $3,700 level. A successful breakout and retest of this level could set the stage for a new all-time high (ATH).

merlijn
Source: Merlijn The Trader on X

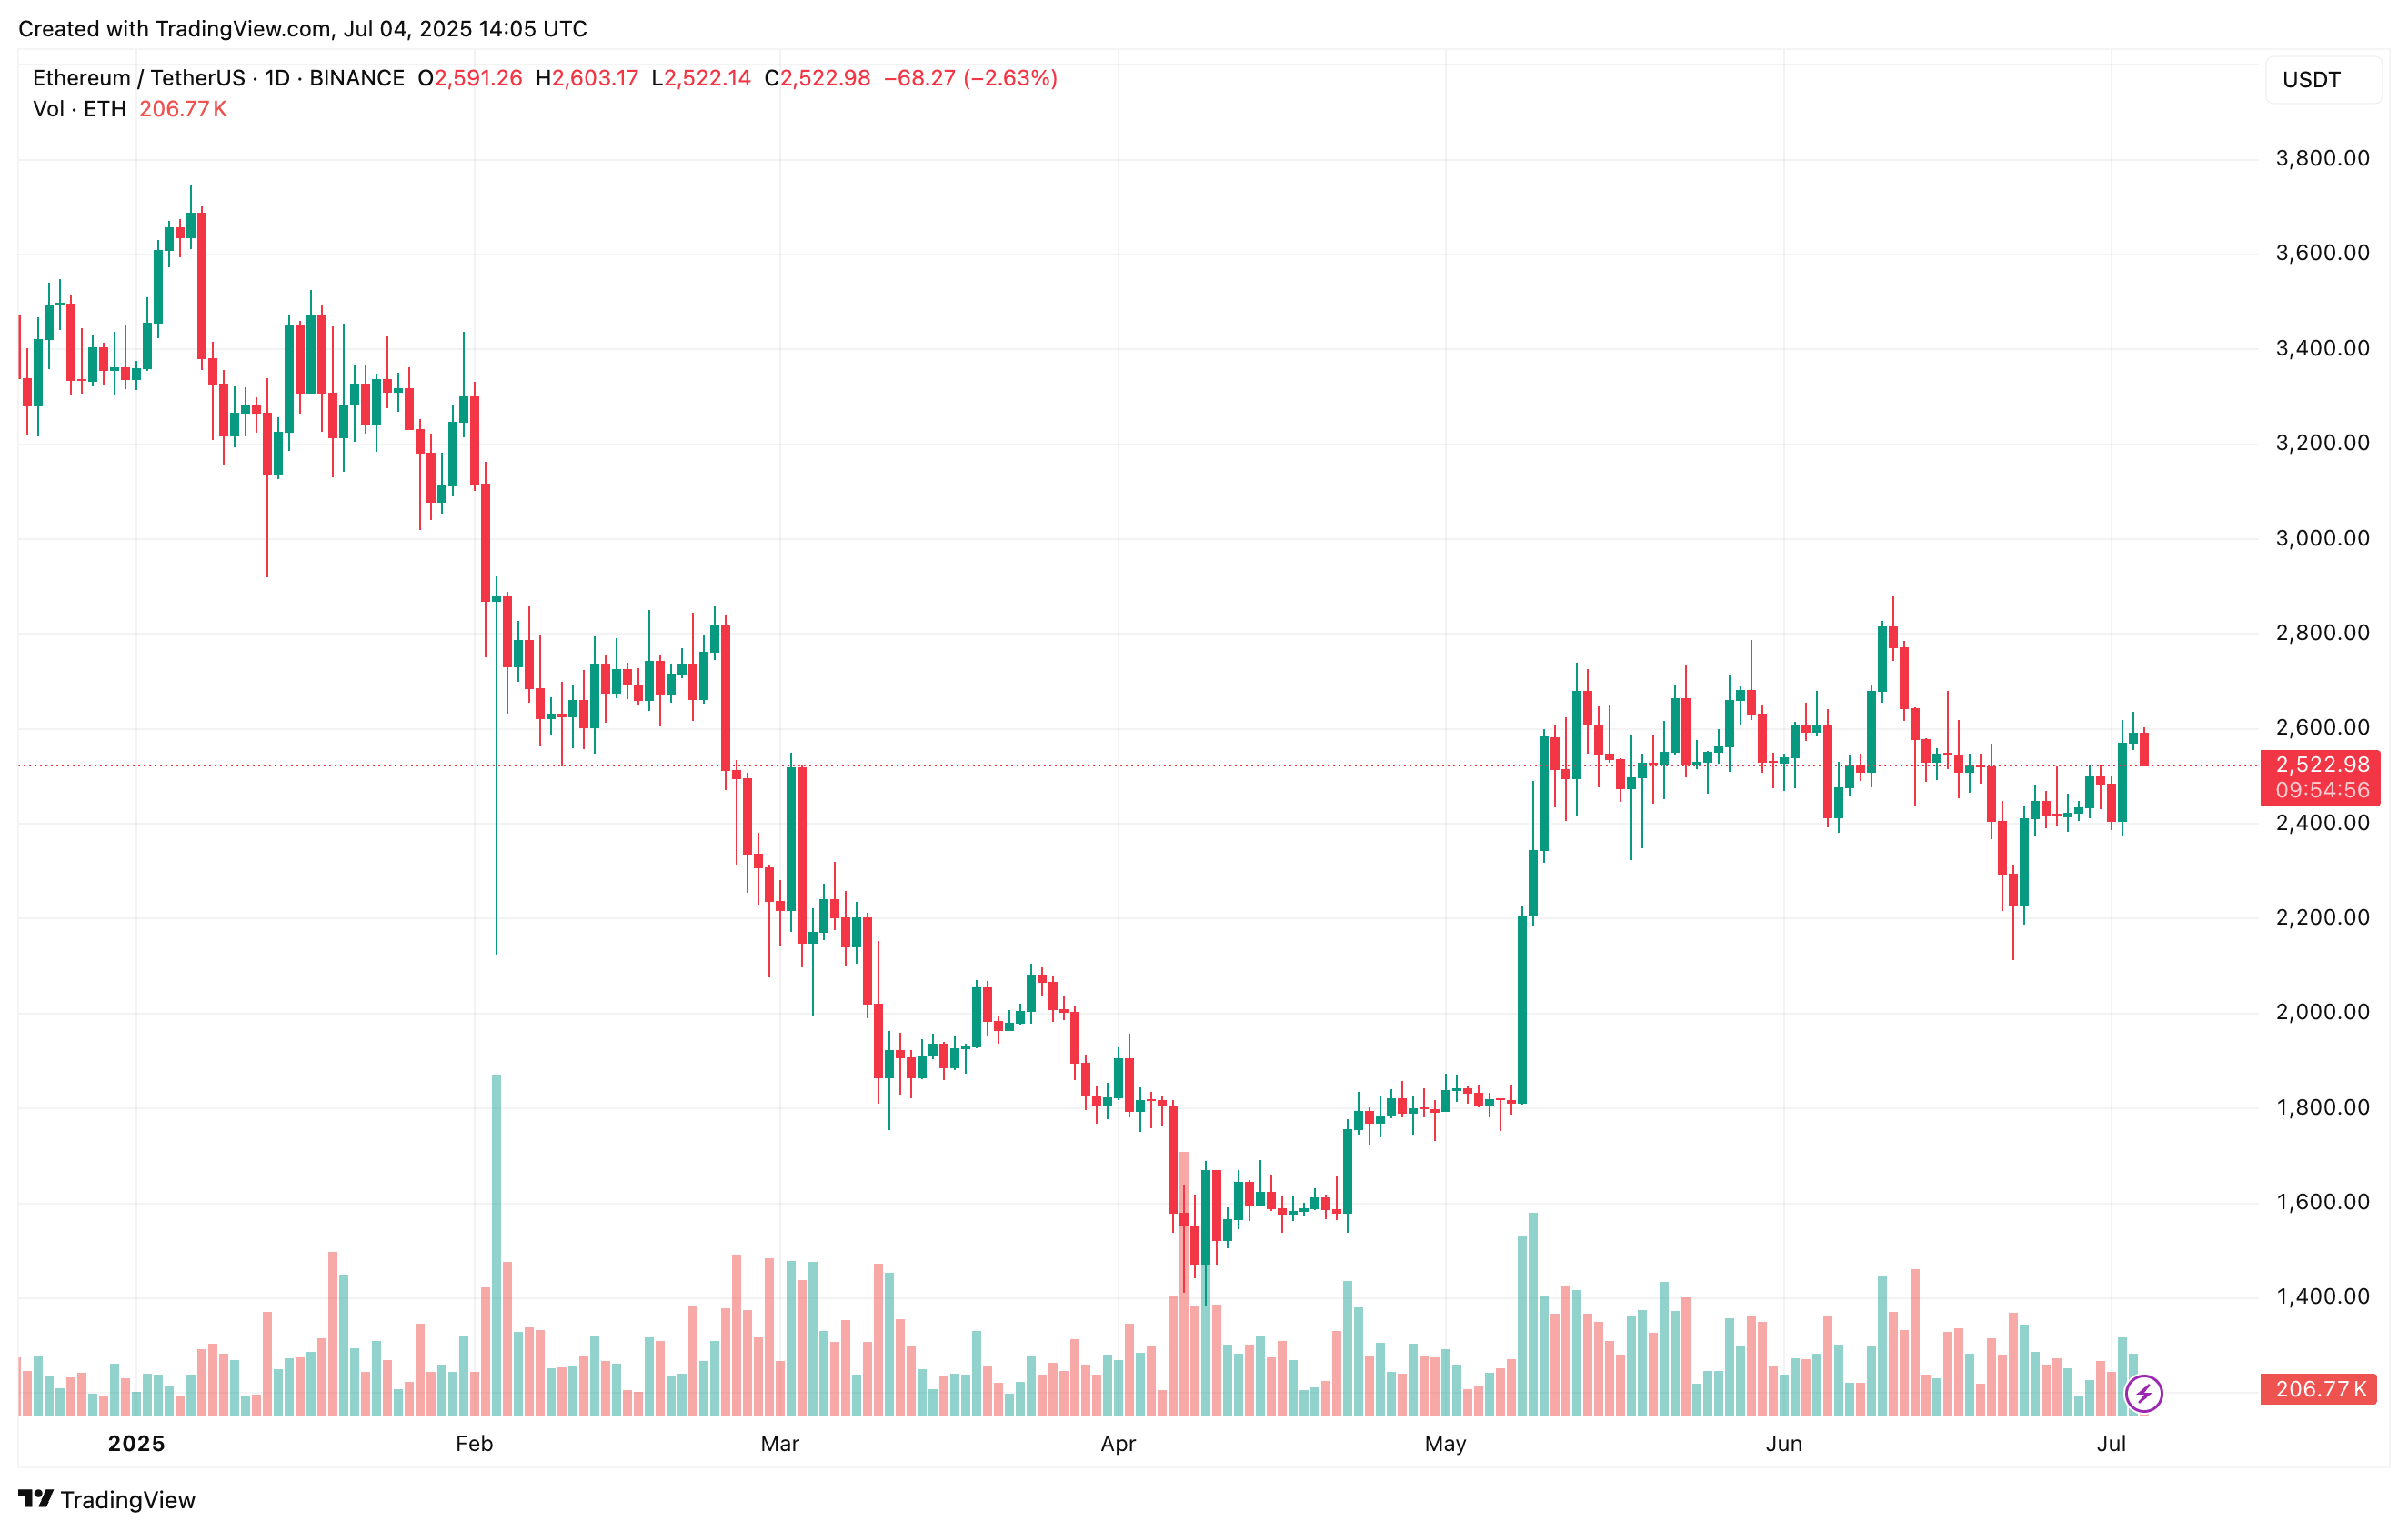
Fellow crypto analyst Crypto GEMs also pointed toward Ethereum getting ready for a significant move to the upside. The analyst shared the following chart which compares ETH’s price action in 2025 to that in 2024.

If Ethereum mirrors its 2024 performance, it could break above the $3,000 mark in the near term. However, not all analysts share this bullish outlook.

For instance, noted crypto analyst Carl Moon shared a four-hour Ethereum chart showing the asset trading within a rising wedge pattern. He cautioned that unless ETH breaks out of this formation, it may face a drop to $2,200.

moon
Source: Carl Moon on X

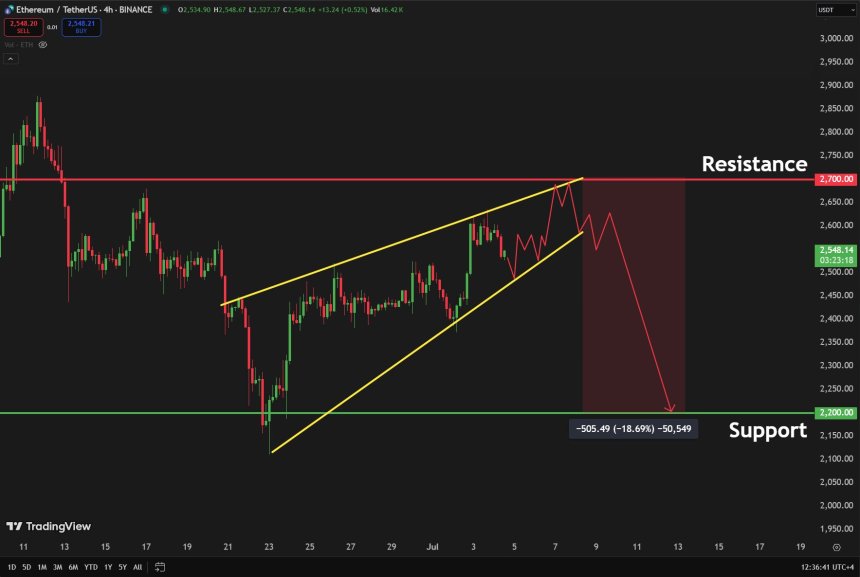
To explain, a rising wedge pattern is a bearish chart formation where price moves upward within converging trendlines, indicating weakening bullish momentum. It often signals an upcoming breakdown, as buyers lose control and sellers push the price lower after the wedge is breached.

ETH Network Sees Renewed Activity

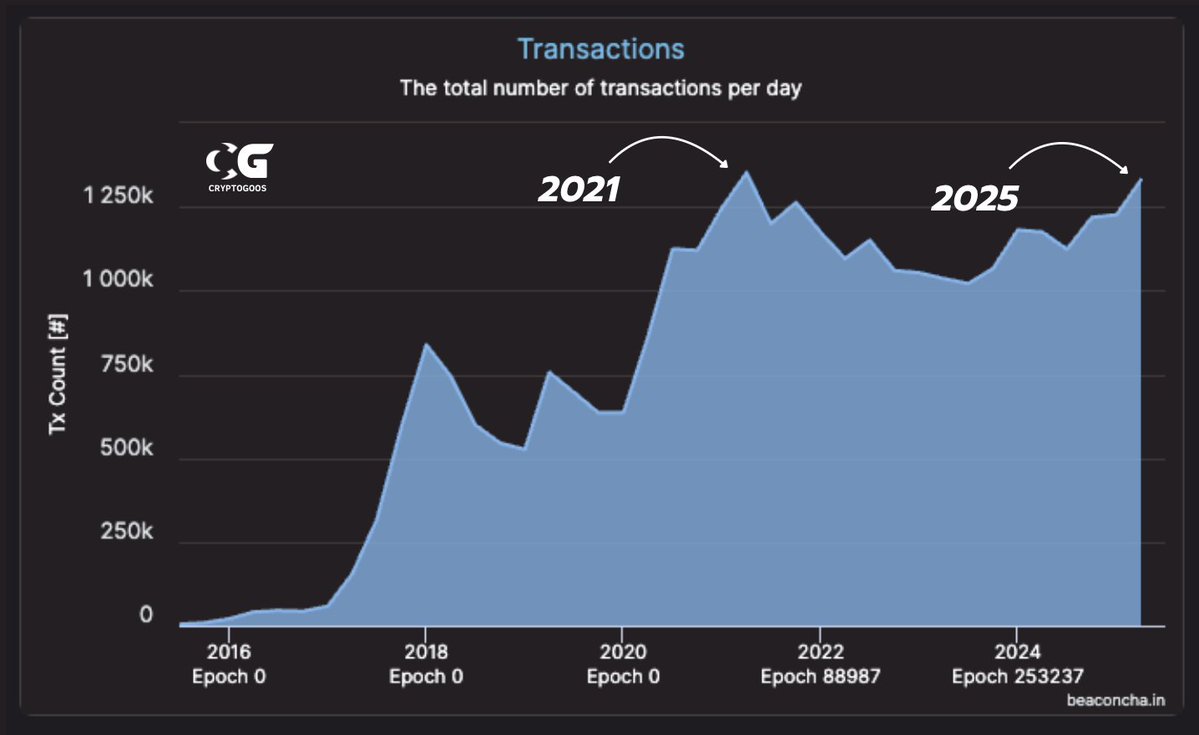
In a separate X post, crypto analyst CryptoGoos remarked that daily transactions on Ethereum are nearing ATH level for the first time since 2021. Typically, heightened network activity tends to precede major price movements.

goos
Source: CryptoGoos on X

Analyst Crypto Rover echoed this view, noting that active addresses across the Ethereum network have hit a new all-time high. They added that ETH below $3,000 is “an absolute steal.”

Related Reading

Meanwhile, Ethereum liquid staking is also inching toward historic levels, with 35.5 million ETH now locked. At press time, ETH trades at $2,522, down 3.8% in the past 24 hours.

ethereum
Ethereum trades at $2,522 on the daily chart | Source: ETHUSDT on TradingView.com

Featured image from Unsplash, charts from X and TradingView.com


Source link

Share. Facebook Twitter Pinterest LinkedIn Tumblr Email
MNK News
  • Website

Related Posts

Dogecoin Trap Shows A Major Crash, But How Low Will The Price Go?

April 27, 2026

Why The 42% Crash From ATH Is Actually Good For Bitcoin And The Crypto Market

April 27, 2026

‘The Beat Goes On’ – Saylor Hints At Another Bitcoin Buying Spree

April 27, 2026
Add A Comment
Leave A Reply Cancel Reply

Editors Picks

Blistering Chapman steers United to Qualifier as sloppy Sultans falter

April 26, 2026

Tickets for HBL PSL 11 final to go on sale from April 27

April 26, 2026

Kings knocked out of PSL despite nine-wicket demolition of Gladiators

April 26, 2026

India to bid for 2038 Asian Games in Ahmedabad

April 25, 2026
Our Picks

Dogecoin Trap Shows A Major Crash, But How Low Will The Price Go?

April 27, 2026

Why The 42% Crash From ATH Is Actually Good For Bitcoin And The Crypto Market

April 27, 2026

‘The Beat Goes On’ – Saylor Hints At Another Bitcoin Buying Spree

April 27, 2026

Recent Posts

  • Dogecoin Trap Shows A Major Crash, But How Low Will The Price Go?
  • Why The 42% Crash From ATH Is Actually Good For Bitcoin And The Crypto Market
  • Planning for Trump’s security during big events may get trickier
  • Studio Pilates To Launch The Pilates Games, a Reformer-Based Workout Competition
  • Ford’s Mustang Cobra Jet sets a new EV quarter mile record at 6.87 seconds

Recent Comments

No comments to show.
MNK News
Facebook X (Twitter) Instagram Pinterest Vimeo YouTube
  • Home
  • About US
  • Advertise
  • Contact US
  • DMCA
  • Privacy Policy
  • Terms & Conditions
© 2026 mnknews. Designed by mnknews.

Type above and press Enter to search. Press Esc to cancel.