


Bitcoin is currently on the path to holding a strong footing above $109,000 after reclaiming the $108,000 price level in the past seven days. Notably, Bitcoin’s price has gained more than $3,000 over the past week, with bullish momentum building steadily across the broader crypto market.
Bitcoin is once again flirting with all-time highs, and popular crypto analyst Merlijn The Trader recently shared a technical analysis on social media that claims Bitcoin has now entered its third parabolic phase. His chart places Bitcoin right on track for another historic climb to crazy price targets even in 2025.
Bitcoin Following Familiar Price Schedule
According to Merlijn’s analysis, Bitcoin’s current market structure is mimicking its past two parabolic rallies that took place in 2017 and 2021. Just like in previous cycles, Bitcoin’s current price cycle has moved through a prolonged consolidation phase and gradually grinded upward.
Related Reading
The next thing now is a vertical breakout. A weekly chart that followed his post on the social media platform X highlighted this trend with three red bowl-shaped curves, each leading into a green “Parabolic Phase” box that represents the final leg of each bull run.
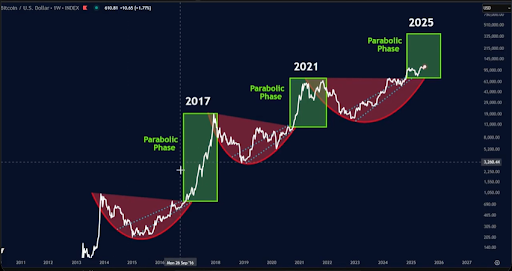
The price action so far in 2024 and 2025 has continued to trace this same path. The curve that began forming after the 2022 bottom is now tilting upward sharply. Interestingly, Bitcoin bounced cleanly off the lower arc during its April crash to $74,000, just as it did in 2016 and 2020 before launching into new all-time highs. Crypto analyst Merlijn believes this rebound is the strongest indication yet that the final breakout phase is approaching.
No Second Chances: Here’s The Price Target
According to the analyst, Bitcoin’s current price structure on the weekly chart has never failed in previous cycles. However, anyone waiting on the sidelines may miss the move entirely. “Bitcoin bounced off the parabolic curve support, momentum is building, and if history rhymes with the biggest burst of the move, this parabolic phase does not give second chances,” he explained.
Related Reading
The most interesting part of Merlijn’s forecast is the price target itself. Based on the chart he shared, the green parabolic zone for 2025 extends as high as $335,000, representing more than a 205% rally from current levels. The mid-region of the box is around $150,000, making even the conservative price target significantly higher than Bitcoin’s current price.
This prediction is based on the magnitude of previous parabolic runs, which saw Bitcoin increase by over 2,000% in 2017 and more than 1,300% from its 2020 lows to its 2021 peak. If the third phase delivers a similar rally, the path to $335,000 may not be far-fetched.
At the time of writing, Bitcoin is trading at $108,850, having reached an intraday high of $109,574.
Featured image from Getty Images, chart from Tradingview.com