


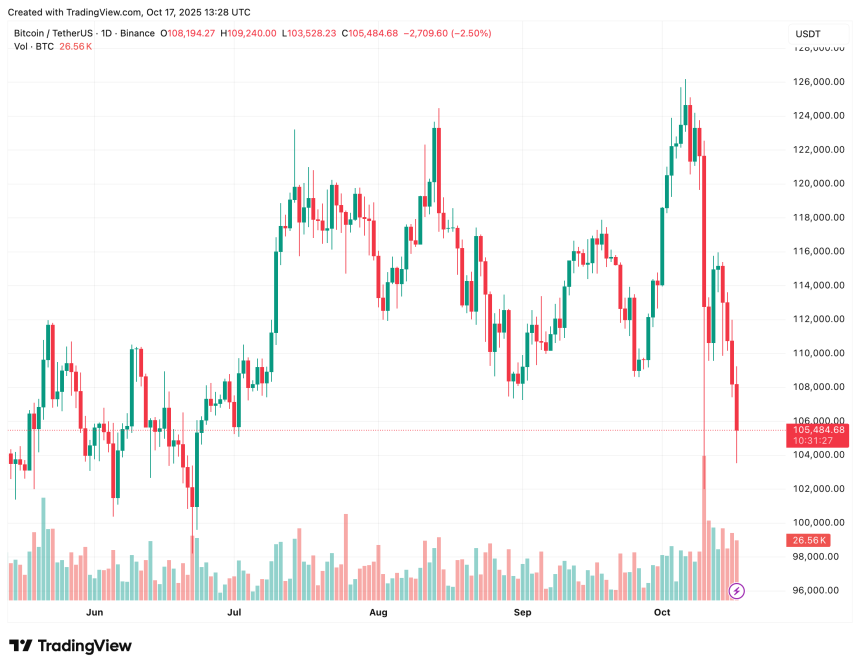
Bitcoin (BTC) continues to lose momentum, as the flagship cryptocurrency fell to $103,528 earlier today amid an increasingly uncertain global macroeconomic outlook. Fresh data from Binance suggests that BTC is currently undergoing a critical transition phase within its price cycle.
Bitcoin Fall Continues – When Will Bloodbath End?
According to a CryptoQuant QuickTake post by contributor Arab Chain, Bitcoin is currently undergoing an important transition phase within its market cycle. The Bitcoin Cycle Phase Score recently entered negative territory, in tandem with a decline in BTC’s price from $124,000 to around $107,000 within 24 hours.
Related Reading
The Cycle Phase Score combines market trend and short-term momentum (Z-Score) to show Bitcoin’s current phase. Positive values indicate upward momentum, while negative values signal short-term weakness or a correction.
The decline in the Cycle Phase Score shows that the BTC market has lost some of its upward momentum that benefited it during the first two weeks of October. The transition to negative territory shows the start of a structural correction phase, following weeks of consecutive gains.
The analyst explained that a trend_signal of -1 confirms that BTC’s price has tumbled below the 200-day moving average. It is likely to trade below this metric until it can decisively break through the $106,780 level.
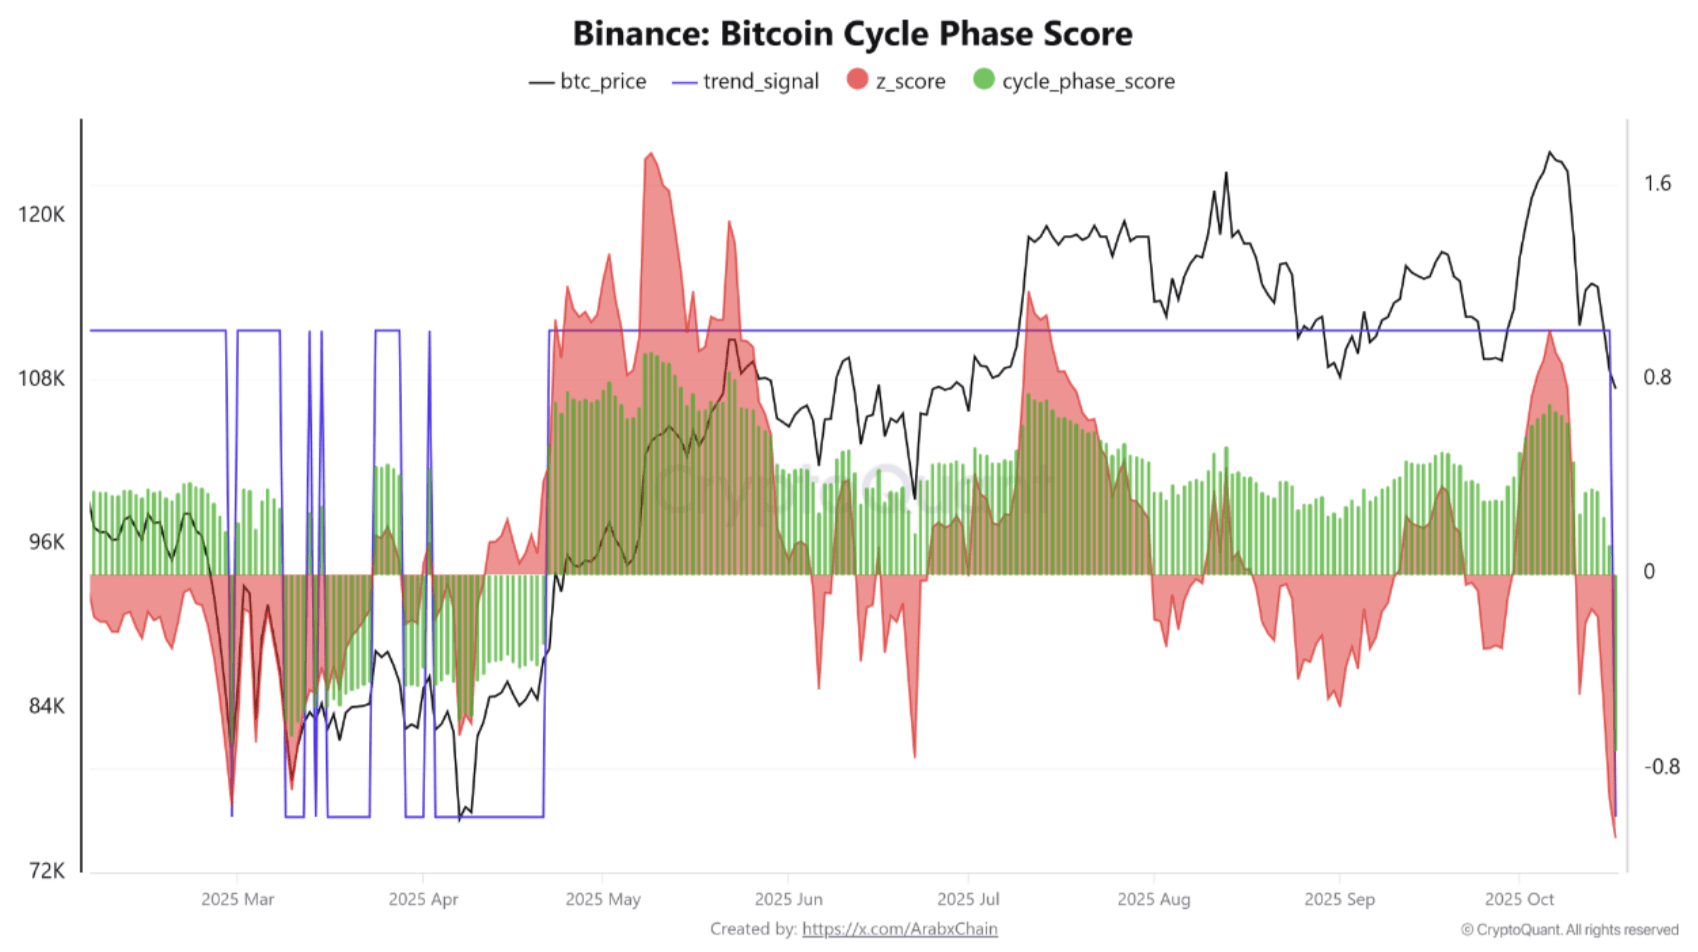
Similarly, a negative Z-score shows that Bitcoin’s price is trading significantly below its short-term average, further confirming the dominance of short-term selling pressure. Arab Chain added:
Analytically, this movement can be viewed as a rebalancing phase within the ongoing cycle, rather than the start of a long-term downtrend. The current pullback follows a strong period of price expansion, which is often followed by a temporary pause in momentum before the main trend resumes.
Arab Chain concluded by saying that if BTC’s price finds stability above $105,000 in the coming days, then the Cycle Phase Score indicator may re-enter the positive region again. Such a development could signal the end of the ongoing price correction phase.
Will BTC Fall Below $100,000?
As BTC trades close to the mid $100,000 level, fears are rising in the market that the digital asset may fall below the psychologically important $100,000 mark. Further, on-chain data is not particularly encouraging, as the Bitcoin network activity recently crashed below the 365-day average.
Related Reading
In addition, crypto analyst CryptoBirb recently stated that the current BTC bull cycle is likely coming to an end. The analyst remarked that Bitcoin is almost 99.3% through its current cycle.
That said, whale accumulation of BTC is showing no signs of slowing down. Companies added a total of 176,000 BTC to their treasuries during Q3 2025. At press time, BTC trades at $105,484, down 5.1% in the past 24 hours.
Featured image from Unsplash, charts from CryptoQuant and TradingView.com