


XRP continues to face pressure as bulls struggle to push the price back above key resistance levels. After weeks of declines, market sentiment remains fragile, with many traders questioning whether the altcoin can find solid footing. However, some analysts still see potential upside — provided XRP manages to reclaim higher levels and attract renewed buying interest.
Related Reading
Fresh data from CryptoQuant sheds light on an important dynamic unfolding behind the scenes. Since the beginning of October, a clear shift has emerged in the behavior of XRP whales. According to the Whale-to-Exchange Flow chart for Binance, a surge in large deposits began on October 1st and persisted until October 17th, marking one of the most active periods of whale movement this year.
This pattern typically signals mounting selling pressure, as large holders transfer assets to exchanges either to take profits or manage risk. Yet, for some analysts, these flows may also indicate repositioning — whales preparing for the next major move once volatility subsides. With on-chain activity rising and price volatility tightening, XRP now finds itself at a pivotal point where the next breakout — or breakdown — could define the rest of October’s trend.
XRP Whale Activity Signals Selling Pressure
According to insights by CryptoOnchain, the surge in XRP whale activity reached its peak on October 11th, when Whale-to-Exchange Transactions climbed to nearly 43,000 — one of the highest levels recorded this year. Such a sharp rise in inflows to centralized exchanges like Binance typically signals mounting selling pressure, as large holders prepare to liquidate positions, secure profits, or hedge against further downside risk.

This wave of whale transfers aligns closely with the broader price trend. Since early October, XRP’s market structure has weakened, confirming that these on-chain movements were not random but rather part of a larger distribution phase. When comparing data, the timing is striking: the escalation in exchange deposits directly corresponds with a sharp price drop from above 3.0 to roughly 2.3, underscoring the weight of institutional or high-net-worth selling.
Such coordinated behavior among large holders often sets the tone for short-term market direction. Historically, heavy whale inflows tend to precede local bottoms, as the liquidity created by sell pressure eventually attracts new buyers. However, for now, this pattern reinforces caution — suggesting that XRP remains under pressure until the outflow-to-inflow ratio flips back in favor of accumulation.
If selling eases and outflows rise again, it could mark the early stages of stabilization. Until then, whale behavior remains a key signal to watch, especially as the asset attempts to recover from one of its steepest declines in recent months.
Related Reading
XRP Price Analysis: Bulls Struggle to Regain Momentum
XRP is showing signs of short-term stabilization after weeks of selling pressure, trading around $2.42 at the time of writing. The recent bounce from the $2.30 support zone suggests that buyers are attempting to defend this key level, but the broader structure remains fragile. The chart shows that XRP continues to trade below its 50-day and 100-day moving averages, signaling that the short- to mid-term trend remains bearish.
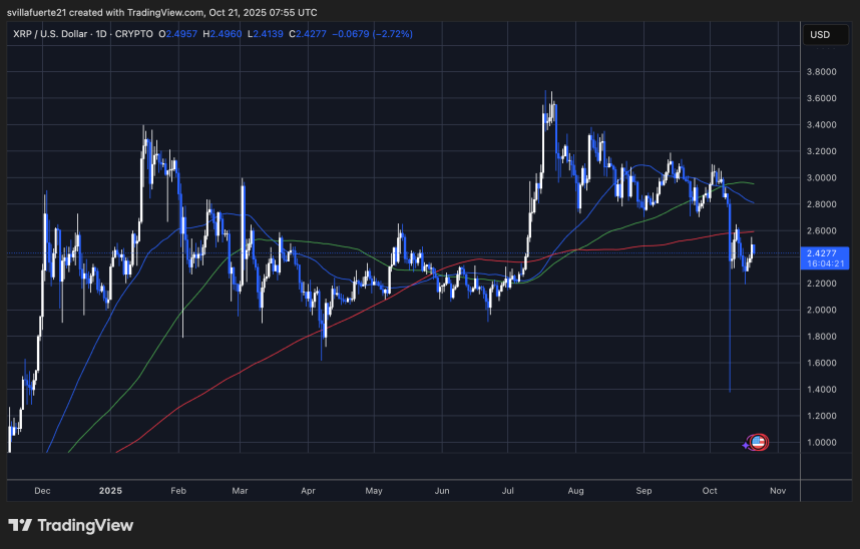
The price failed to reclaim the $2.60–$2.70 resistance range, which now acts as a major supply zone following the sharp decline from early October highs near $3.0. The 200-day moving average, currently hovering around $2.55, is also capping upside momentum, reinforcing the difficulty for bulls to regain control.
Related Reading
If XRP closes above $2.60, it could open the door for a retest of $2.90. However, losing the $2.30 support would expose the next key level near $2.00, where the market may attempt to find stronger demand.
Overall, XRP remains in a delicate position — oscillating between potential recovery and further downside risk. The coming sessions will be decisive, as price action consolidates under heavy whale-driven selling pressure and uncertain sentiment.
Featured image from ChatGPT, chart from TradingView.com