


A new projection from an XRP analyst is drawing fresh attention to how quickly spot ETFs could gobble up available tokens if heavy inflows persist.
Related Reading
The numbers in the model are simple and large, and they force a straightforward question: what happens if steady ETF buying meets a limited public supply?
ETF Flows Could Outrun Supply
According to analyst Chad Steingraber, one XRP ETF might average $90 million in daily inflows. Multiplying that by 12 ETFs and the result is $1.08 billion each day.
Based on his assumptions, if half of those flows create fresh demand for XRP, issuers would need to buy about $504 million worth — roughly 229 million XRP — in a single day.
One Day Billion ETF Flow Scenario (assume current price)
Single Fund Day Avg – $90Million
x12 Funds Avg – $1.08Billion Day
50% Avg Net Share Creation – $504Million
Required Acquisition – 229,090,909 XRP —> 1 DayFor fun — what if one week:
x5 Days – 1,145,454,545 XRPWhat if… https://t.co/wpdDD1q7bn
— Chad Steingraber (@ChadSteingraber) November 19, 2025
Stretch that pace for a week and the total climbs to 1.14 billion XRP. A month pushes it to 4.58 billion XRP. After six months, the model reaches 27.49 billion XRP, which is nearly half of the roughly 60 billion XRP currently in circulation.
According to the projection, a full year at those levels could theoretically absorb the entire public supply unless prices move higher and slow purchases.
Early Fund Flows Show Demand But Not A Shock
Reports show Canary Capital’s XRPC ETF opened with $245 million in day-one inflows, followed by $25.41 million and $8.32 million on the next two days, bringing the fund to $277 million in assets.
Franklin Templeton’s EZRP is scheduled to launch on November 24 and market estimates put first-day demand between $150–$250 million. Five other issuers — Bitwise, Grayscale, 21Shares, Valkyrie, and CoinShares — are waiting in line.
Community math that assumes seven ETFs has produced a $7.2 billion annual inflow figure. That is a lot of money. But, so far, the market reaction has been muted rather than explosive.
Related Reading
According to analysts, fund purchases don’t hit public exchanges right away. Trades settle on a certain cycle, and many issuers buy XRP over-the-counter.
As a result, large amounts could be accumulated quietly before they show up in exchange order books or pressure the spot price.
$XRP
Lost the previous breakout level.
Looks headed back to $1.50 area. pic.twitter.com/8VskyzrPXk
— Nebraskangooner (@Nebraskangooner) November 17, 2025
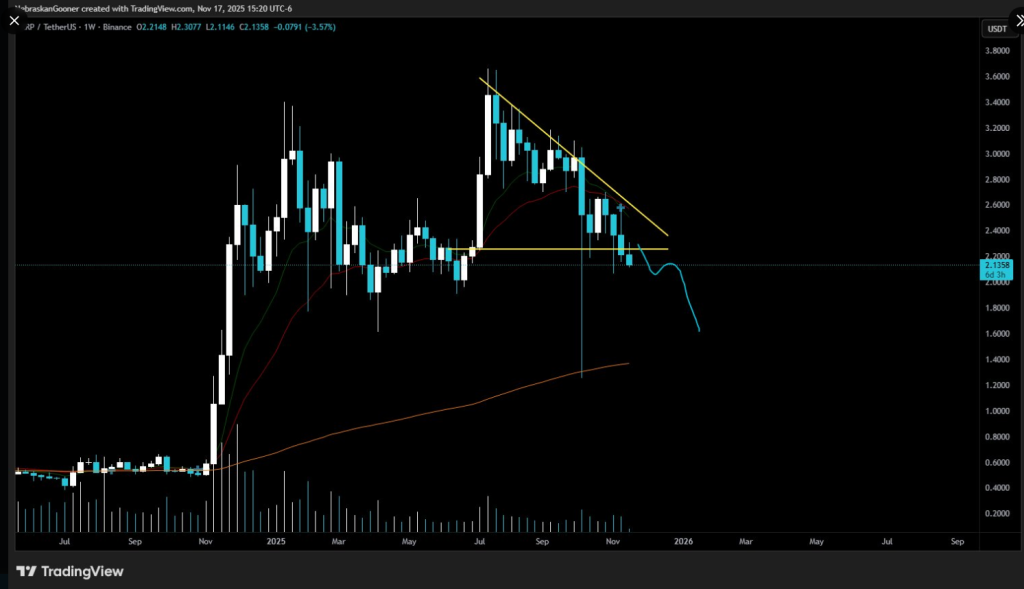
Price Dynamics And Technical Risks
XRP’s price has not marched upward in lockstep with ETF headlines. The token has hovered near $2.14 and slipped more than 14% since last week.
Technical voices in the market are warning about downside. Analyst Nebraskangooner points to a failed breakout from a descending triangle and sets a target near $1.50 — roughly a 30% drop from a recent $2.15 trading level.
The chart argument traces a rally to a yearly high of $3.66 in July, a late-October attempt to break higher, and a subsequent break below support around $2.2.
Featured image from Gemini, chart from TradingView