Close Menu
  • Home
  • AI & Technology
  • Politics
  • Business
  • Cryptocurrency
  • Sports
  • Finance
  • Fitness
  • Gadgets
  • World
  • Marketing

Subscribe to Updates

Subscribe to our newsletter and never miss our latest news

Subscribe my Newsletter for New Posts & tips Let's stay updated!

What's Hot

X has to prove it wasn’t negligent when removing CSAM from its site

August 2, 2025

‘World’s Oldest Baby’ Born from 30-Year-Old Frozen Embryo

August 2, 2025

Exchanges Receive 21,400 Bitcoin At A Loss From Short-Term Holders

August 2, 2025
Facebook X (Twitter) Instagram
  • Home
  • About US
  • Advertise
  • Contact US
  • DMCA
  • Privacy Policy
  • Terms & Conditions
Facebook X (Twitter) Instagram
MNK NewsMNK News
  • Home
  • AI & Technology
  • Politics
  • Business
  • Cryptocurrency
  • Sports
  • Finance
  • Fitness
  • Gadgets
  • World
  • Marketing
MNK NewsMNK News
Home » Spot Ethereum ETFs Set A New Record In July With $5.4 Billion Monthly Inflow
Cryptocurrency

Spot Ethereum ETFs Set A New Record In July With $5.4 Billion Monthly Inflow

MNK NewsBy MNK NewsAugust 2, 2025No Comments3 Mins Read
Facebook Twitter Pinterest LinkedIn Tumblr Email
Share
Facebook Twitter LinkedIn Pinterest Email


In a powerful show of investor confidence, spot Ethereum exchange-traded funds (ETFs) broke all records in July with $5.43 billion in net inflows. It marks the highest monthly inflow since their market debut and reflects a sharp 369% rise from June’s inflow of $1.16 billion. 

With 20 straight days of net inflows, spot ETH ETFs are now cementing Ethereum’s growing role as a leading digital asset in the eyes of traditional market participants.

Spot Ethereum ETFs Hit Milestone With $5.43 Billion Inflow

According to data from SoSoValue, the $5.43 billion net inflow in July also dwarfed May’s $564 million and April’s $66.25 million. It completely reversed the negative outflow trend seen in March, which saw a $403 million drop. As a result of this rise, cumulative net inflows across all spot Ether ETFs have now reached $9.64 billion, showing a 129% increase compared to June’s cumulative total.

Related Reading

Spot Ethereum ETFs
Source: SoSoValue

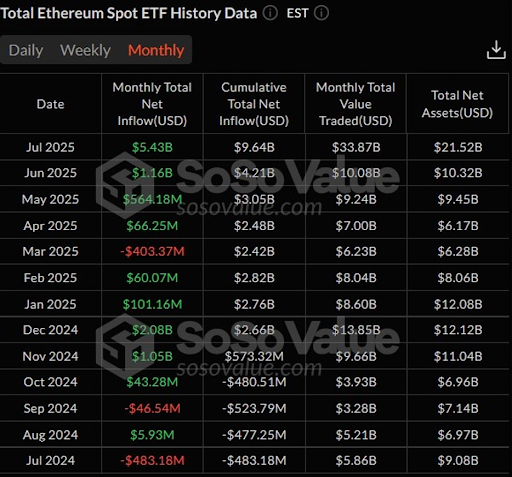
The massive growth didn’t stop at inflows alone. Total net assets across all spot ETH ETFs jumped to $21.52 billion, doubling from $10.32 billion just a month earlier. These funds now account for 4.77% of Ethereum’s entire market capitalization, showing that ETFs are becoming a gateway for capital entering the ETH market.

Institutional interest has played a role in this growth as BlackRock’s ETHA remains the leading spot Ethereum ETF by assets, pulling in $18.18 million on July 31 and now holding $11.37 billion. Fidelity’s FETH also gained $5.62 million that same day, raising its net assets to $2.55 billion. Grayscale’s ETHE still manages a solid $4.22 billion asset base, even with a $6.8 million outflow, showing its continued relevance.

Ethereum Price Rallies As ETF Inflows Hit New Highs

The record-setting ETF inflows also lined up with a sharp price rally in ETH throughout July. ETH started the month at $2,486 and climbed to a high of $3,933, an increase of nearly 60%. By the end of the month, it had settled at $3,698, making July Ethereum’s strongest monthly price move since October 2021. The steady rise in ETF inflows could be a key driver behind this surge, showing that more capital entering the space may have directly boosted market sentiment and pricing.

Related Reading

The ETH rally also marked the longest bullish monthly candle in nearly three years. As prices climbed, the spot ETFs recorded their longest-ever streak of daily net inflows, 20 days in a row without a single outflow after July 8. Some of the single-day gains came mid-month, including $726.7 million on July 16, $602 million on July 17, and $533.8 million on July 22.

Ethereum could challenge its all-time high of $4,878, set in November 2021, as its rising role in decentralized finance and the growing use of regulated investment vehicles could help the asset. If the current pace of inflows and trading activity continues, it could soon take center stage in a broader altcoin-led market cycle. 

Ethereum price chart from TradingView.com
Selling pressure sends ETH below $3,500 | Source: ETHUSDT on TradingView.com

Featured image from UnSplash, chart from TradingView.com


Source link

Share. Facebook Twitter Pinterest LinkedIn Tumblr Email
MNK News
  • Website

Related Posts

Exchanges Receive 21,400 Bitcoin At A Loss From Short-Term Holders

August 2, 2025

Ethereum New Addresses Surge To Nearly 257K In A Day, Matching 2017 And 2021 Bull Markets

August 2, 2025

Here’s What Is Happening And Where ETH Is Headed Next

August 2, 2025
Add A Comment
Leave A Reply Cancel Reply

Editors Picks

SA want promising T20 batters to show potential – Sport

August 2, 2025

Gauff fights back to advance in Canada, Medvedev crashes out – Sport

August 2, 2025

Santner-inspired New Zealand beat Zimbabwe in first Test – Sport

August 2, 2025

Pakistan, Afghanistan, UAE to play T20I tri-series in Sharjah – Sport

August 1, 2025
Our Picks

Exchanges Receive 21,400 Bitcoin At A Loss From Short-Term Holders

August 2, 2025

Spot Ethereum ETFs Set A New Record In July With $5.4 Billion Monthly Inflow

August 2, 2025

Ethereum New Addresses Surge To Nearly 257K In A Day, Matching 2017 And 2021 Bull Markets

August 2, 2025

Recent Posts

  • X has to prove it wasn’t negligent when removing CSAM from its site
  • ‘World’s Oldest Baby’ Born from 30-Year-Old Frozen Embryo
  • Exchanges Receive 21,400 Bitcoin At A Loss From Short-Term Holders
  • Spot Ethereum ETFs Set A New Record In July With $5.4 Billion Monthly Inflow
  • YouTube is testing Instagram-style collabs

Recent Comments

No comments to show.
MNK News
Facebook X (Twitter) Instagram Pinterest Vimeo YouTube
  • Home
  • About US
  • Advertise
  • Contact US
  • DMCA
  • Privacy Policy
  • Terms & Conditions
© 2025 mnknews. Designed by mnknews.

Type above and press Enter to search. Press Esc to cancel.