Close Menu
  • Home
  • AI & Technology
  • Politics
  • Business
  • Cryptocurrency
  • Sports
  • Finance
  • Fitness
  • Gadgets
  • World
  • Marketing

Subscribe to Updates

Subscribe to our newsletter and never miss our latest news

Subscribe my Newsletter for New Posts & tips Let's stay updated!

What's Hot

Trump administration posts Easter messages celebrating Christ’s resurrection

April 5, 2026

NASA shares breathtaking images of Artemis II astronauts taking in the view from Orion’s windows

April 5, 2026

Analyst Identifies $63,000 As Key Support For Next Bitcoin Move

April 5, 2026
Facebook X (Twitter) Instagram
  • Home
  • About US
  • Advertise
  • Contact US
  • DMCA
  • Privacy Policy
  • Terms & Conditions
Facebook X (Twitter) Instagram
MNK NewsMNK News
  • Home
  • AI & Technology
  • Politics
  • Business
  • Cryptocurrency
  • Sports
  • Finance
  • Fitness
  • Gadgets
  • World
  • Marketing
MNK NewsMNK News
Home » Bitcoin Network Activity Slumps To One-Year Low
Cryptocurrency

Bitcoin Network Activity Slumps To One-Year Low

MNK NewsBy MNK NewsFebruary 10, 2025No Comments3 Mins Read
Facebook Twitter Pinterest LinkedIn Tumblr Email
Share
Facebook Twitter LinkedIn Pinterest Email


Este artículo también está disponible en español.

According to a recent CryptoQuant Research post, Bitcoin (BTC) network activity has slumped to a 12-month low, with CryptoQuant’s Bitcoin Network Activity Index currently at its lowest level since February 2024.

Bitcoin Network Activity Drops As Market Consolidates

Data from CryptoQuant’s Bitcoin Network Activity Index shows that activity has declined by 15% from its peak in November 2024. As of February 5, the Index stands at 3,760, marking its lowest level in the past year.

Related Reading

The decline in network activity is primarily attributed to a sharp drop in the number of transactions on the Bitcoin network. From an all-time high (ATH) of 734,000 transactions in September 2024, the total daily transaction count has fallen by 53% to 346,000.

According to CryptoQuant, this downturn in BTC network activity is largely driven by a decline in the use of the Runes Protocol for minting tokens on the blockchain. The post explains:

This is evident in the total daily number of OP RETURN codes in Bitcoin transactions, which the RUNES protocol uses to write data about token mints and transfers on the network. When the RUNES protocol emerged in April 2024, the daily number of OP RETURN codes spiked to 802K. However, the number of OP RETURN code has plummeted since, with only 10K OP RETURN codes used.

For the uninitiated, The Runes Protocol is a new token standard for BTC, designed to enable fungible token creation directly on the network without requiring off-chain data or complex smart contracts. It aims to be more efficient and scalable than previous Bitcoin tokenization methods like Ordinals and BRC-20.

Further evidence of reduced network activity is visible in Bitcoin mempool traffic. The total number of pending transactions waiting to be confirmed in a Bitcoin block has plummeted by 99%, from 287,000 in December 2024 to just 3,000 as of February 5, 2025. Notably, this is the lowest level of mempool traffic since March 2022.

Is BTC Overvalued At Current Price?

The analysis suggests that, based on network activity, Bitcoin’s fair value currently falls between $48,000 and $95,000. This implies that BTC’s current market price of around $98,000 may be overvalued.

Related Reading

However, another CryptoQuant contributor argues that the current Bitcoin price presents a strong buying opportunity for investors looking to dollar-cost average their holdings. Similarly, another analyst suggests that BTC’s recent market performance indicates it is in the distribution phase of the market cycle.

Despite short-term concerns, the long-term outlook for BTC remains bullish. A Standard Chartered executive recently predicted that Bitcoin could reach $200,000 by the end of 2025. At press time, BTC trades at $97,914, down 0.1% in the past 24 hours.

bitcoin
BTC trades at $97,914 on the daily chart | Source: BTCUSDT on TradingView.com

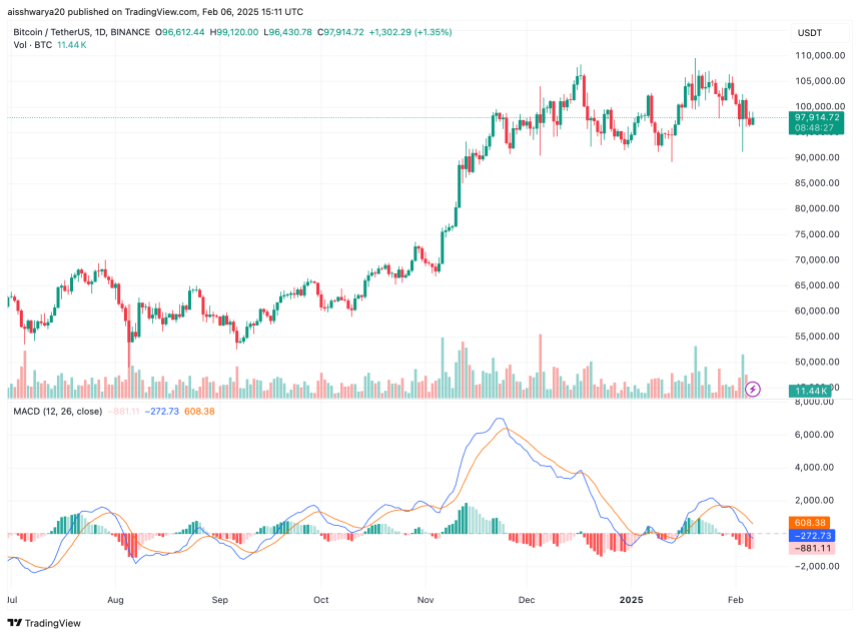
Featured image from Unsplash, Chart from TradingView.com


Source link

Share. Facebook Twitter Pinterest LinkedIn Tumblr Email
MNK News
  • Website

Related Posts

Analyst Identifies $63,000 As Key Support For Next Bitcoin Move

April 5, 2026

Ethereum Net Taker Volume Rises To Most Positive Level Since 2023 – Bullish Reversal Soon?

April 5, 2026

Bitcoin On-Chain Data Hints At Macro Bottom Near $47,960

April 5, 2026
Add A Comment
Leave A Reply Cancel Reply

Editors Picks

Pegula reaches WTA Charleston Open semi-finals with latest three-setter

April 5, 2026

Rs20 million fine for a deleted tweet: The cost of irreverence?

April 4, 2026

City host Liverpool, Arsenal chase treble in FA Cup quarter-finals

April 3, 2026

Italy’s football chief resigns after World Cup disaster

April 2, 2026
Our Picks

Analyst Identifies $63,000 As Key Support For Next Bitcoin Move

April 5, 2026

Ethereum Net Taker Volume Rises To Most Positive Level Since 2023 – Bullish Reversal Soon?

April 5, 2026

Bitcoin On-Chain Data Hints At Macro Bottom Near $47,960

April 5, 2026

Recent Posts

  • Trump administration posts Easter messages celebrating Christ’s resurrection
  • NASA shares breathtaking images of Artemis II astronauts taking in the view from Orion’s windows
  • Analyst Identifies $63,000 As Key Support For Next Bitcoin Move
  • The UK government reportedly wants Anthropic to expand its presence in London
  • Samsung will discontinue its Messages app in July and replace it with Google’s

Recent Comments

No comments to show.
MNK News
Facebook X (Twitter) Instagram Pinterest Vimeo YouTube
  • Home
  • About US
  • Advertise
  • Contact US
  • DMCA
  • Privacy Policy
  • Terms & Conditions
© 2026 mnknews. Designed by mnknews.

Type above and press Enter to search. Press Esc to cancel.