Close Menu
  • Home
  • AI & Technology
  • Politics
  • Business
  • Cryptocurrency
  • Sports
  • Finance
  • Fitness
  • Gadgets
  • World
  • Marketing

Subscribe to Updates

Subscribe to our newsletter and never miss our latest news

Subscribe my Newsletter for New Posts & tips Let's stay updated!

What's Hot

Anthony Scaramucci Puts Bitcoin Market Cap At $21 Trillion, So How Much Will 1 BTC Be?

April 21, 2026

Cash App now supports accounts for kids 6-12

April 21, 2026

Apple’s Incoming CEO John Ternus Faces Critical Test in Addressing AI Strategy Gap

April 21, 2026
Facebook X (Twitter) Instagram
  • Home
  • About US
  • Advertise
  • Contact US
  • DMCA
  • Privacy Policy
  • Terms & Conditions
Facebook X (Twitter) Instagram
MNK NewsMNK News
  • Home
  • AI & Technology
  • Politics
  • Business
  • Cryptocurrency
  • Sports
  • Finance
  • Fitness
  • Gadgets
  • World
  • Marketing
MNK NewsMNK News
Home » XRP 2017 Pattern Returns in 2025, Analyst Predicts Massive Rally
Cryptocurrency

XRP 2017 Pattern Returns in 2025, Analyst Predicts Massive Rally

MNK NewsBy MNK NewsOctober 12, 2025No Comments3 Mins Read
Facebook Twitter Pinterest LinkedIn Tumblr Email
Share
Facebook Twitter LinkedIn Pinterest Email


XRP has been through a rollercoaster over the past few days, tumbling in a crash alongside the rest of the crypto market. The crash drove XRP’s price to a flash low of $1.64 before it recovered to $2.36, with volumes surging 164% above the 30-day average. This flash crash created a notable downside wick on XRP’s price chart, which, according to a technical analyst, is reminiscent of a 2017 price structure that suggests that the cryptocurrency is about to enter into a massive rally.

XRP 2017 And 2025 Setup Shows Striking Similarities

XRP’s recent flash crash has grabbed the attention of a crypto analyst known as ChartNerd on the social media platform X. The analyst drew parallels between XRP’s 2017 price structure and its current 2025 setup. The post included two charts that show similar pre-euphoria wicks that previously led to XRP’s most explosive bull run in 2017.

Related Reading

Back in 2017, XRP’s price action saw a sharp pre-euphoria wick to the downside that wiped out 58% of its value. This wipeout was very short, however, as the coin eventually went on a 5,361% surge to new all-time highs. The rally played out over months and saw the XRP price go from around $0.007 to its then all-time high of $3.40 in 2018. 

It would seem the most recent price crash has led to the creation of a downside wick that mirrors the 2017 one exactly. After the marketwide crash, the token rebounded from lows around $1.60 to trade above $2.30, pointing to a possible recovery phase that might resemble the start of its 2017 exponential rise.

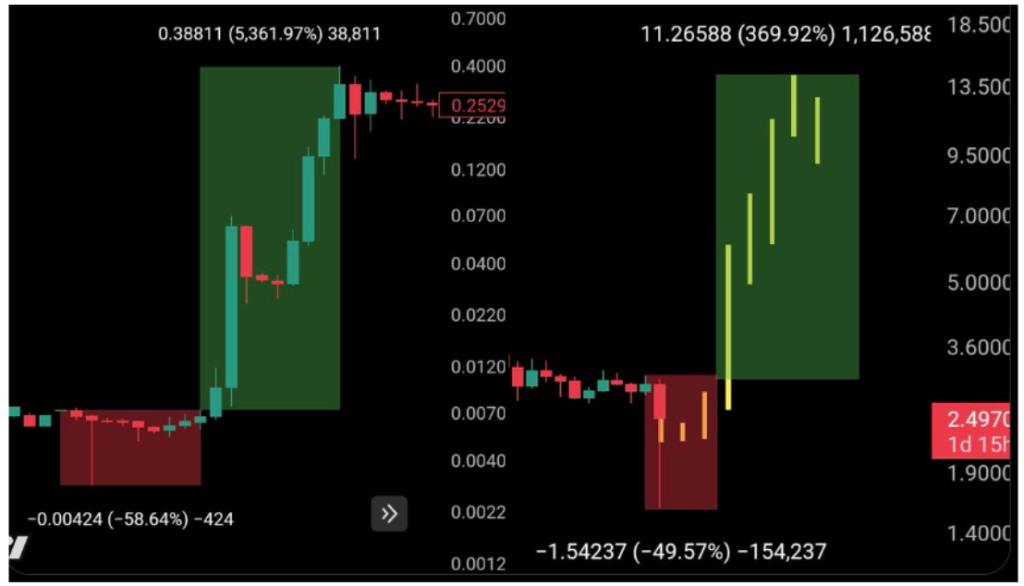
XRP 2017 vs. XRP 2025. Source: @ChartNerdTA on X

What Does This Mean For XRP?

The similarity between 2017 and the current setup provides a bullish outlook for the altcoin within a landscape that’s currently full of bearish momentum. The analyst noted that the $2.40 and $2.00 zones now act as XRP’s important support lifeline, and holding this range could pave the way for an upward trajectory to new price highs.

If XRP repeats the 2017 rally, the price target based on current price levels would be around $13.5. Replicating such a move in 2025 would require more inflows than the 2017 rally. These inflows can only come through participation from institutional investors, which will be slowly rebuilding after recent marketwide volatility.

An important factor that could fast-track this process is the approval and launch of Spot XRP ETFs. The approval of such ETFs has already been widely speculated within the XRP community, and their introduction will undoubtedly open up the cryptocurrency to institutional investors.

Related Reading

At the time of writing, XRP is trading at $2.38, down by 22% in a seven-day timeframe. If it follows the 2017 playout to the core, XRP might spend some weeks consolidating around its current price levels before it embarks on this projected rally.

Featured image from Pexels, chart from TradingView


Source link

Share. Facebook Twitter Pinterest LinkedIn Tumblr Email
MNK News
  • Website

Related Posts

Anthony Scaramucci Puts Bitcoin Market Cap At $21 Trillion, So How Much Will 1 BTC Be?

April 21, 2026

Arbitrum Freezes KelpDAO Hack Funds, Exposing Crypto’s Biggest Lie

April 21, 2026

Bitcoin Fear Fading? Sentiment Hits Highest Since Mid-January

April 21, 2026
Add A Comment
Leave A Reply Cancel Reply

Editors Picks

Babar was not utilised properly in T20 World Cup: Azhar Mahmood

April 21, 2026

Sri Lanka’s Dasun Shanaka handed one-year PSL ban for IPL switch

April 20, 2026

Late bloomer Salman Mirza sets sights on 2027 World Cup

April 20, 2026

Kings slump to another defeat as Sultans trio star

April 19, 2026
Our Picks

Anthony Scaramucci Puts Bitcoin Market Cap At $21 Trillion, So How Much Will 1 BTC Be?

April 21, 2026

Arbitrum Freezes KelpDAO Hack Funds, Exposing Crypto’s Biggest Lie

April 21, 2026

Bitcoin Fear Fading? Sentiment Hits Highest Since Mid-January

April 21, 2026

Recent Posts

  • Anthony Scaramucci Puts Bitcoin Market Cap At $21 Trillion, So How Much Will 1 BTC Be?
  • Cash App now supports accounts for kids 6-12
  • Apple’s Incoming CEO John Ternus Faces Critical Test in Addressing AI Strategy Gap
  • Arbitrum Freezes KelpDAO Hack Funds, Exposing Crypto’s Biggest Lie
  • Bitcoin Fear Fading? Sentiment Hits Highest Since Mid-January

Recent Comments

No comments to show.
MNK News
Facebook X (Twitter) Instagram Pinterest Vimeo YouTube
  • Home
  • About US
  • Advertise
  • Contact US
  • DMCA
  • Privacy Policy
  • Terms & Conditions
© 2026 mnknews. Designed by mnknews.

Type above and press Enter to search. Press Esc to cancel.