Close Menu
  • Home
  • AI & Technology
  • Politics
  • Business
  • Cryptocurrency
  • Sports
  • Finance
  • Fitness
  • Gadgets
  • World
  • Marketing

Subscribe to Updates

Subscribe to our newsletter and never miss our latest news

Subscribe my Newsletter for New Posts & tips Let's stay updated!

What's Hot

Ethereum Sees First SuperTrend Bullish Flip In Over A Year

April 22, 2026

XRP Price Bounce Losing Steam, Failure Signals Could Emerge

April 22, 2026

Solana Foundation President Explains Why SOL Is Built For Unified Liquidity

April 22, 2026
Facebook X (Twitter) Instagram
  • Home
  • About US
  • Advertise
  • Contact US
  • DMCA
  • Privacy Policy
  • Terms & Conditions
Facebook X (Twitter) Instagram
MNK NewsMNK News
  • Home
  • AI & Technology
  • Politics
  • Business
  • Cryptocurrency
  • Sports
  • Finance
  • Fitness
  • Gadgets
  • World
  • Marketing
MNK NewsMNK News
Home » Bitcoin Decouples From Miner Flows With -0.15 Correlation
Cryptocurrency

Bitcoin Decouples From Miner Flows With -0.15 Correlation

MNK NewsBy MNK NewsOctober 10, 2025No Comments3 Mins Read
Facebook Twitter Pinterest LinkedIn Tumblr Email
Share
Facebook Twitter LinkedIn Pinterest Email


Following a slight slump yesterday from its recent highs, Bitcoin (BTC) is now trading in the low $120,000 range. Meanwhile, BTC’s miner correlation has undergone a significant shift over the past few months, indicating a clear change in market dynamics between miner behavior and price direction.

Bitcoin Miner Correlation Turns Negative

According to a CryptoQuant Quicktake post by contributor Arab Chain, fresh data from Binance shows that Bitcoin price and miner flows to the crypto exchange have undergone a significant shift in recent months.

Related Reading

Specifically, the 30-Day Rolling Correlation indicator has tumbled to its lowest level since March 2025. On October 3, this indicator fell to -0.157, its lowest reading in more than five months. Since then, it has remained close to the -0.10 range.

bitcoin
Source: CryptoQuant

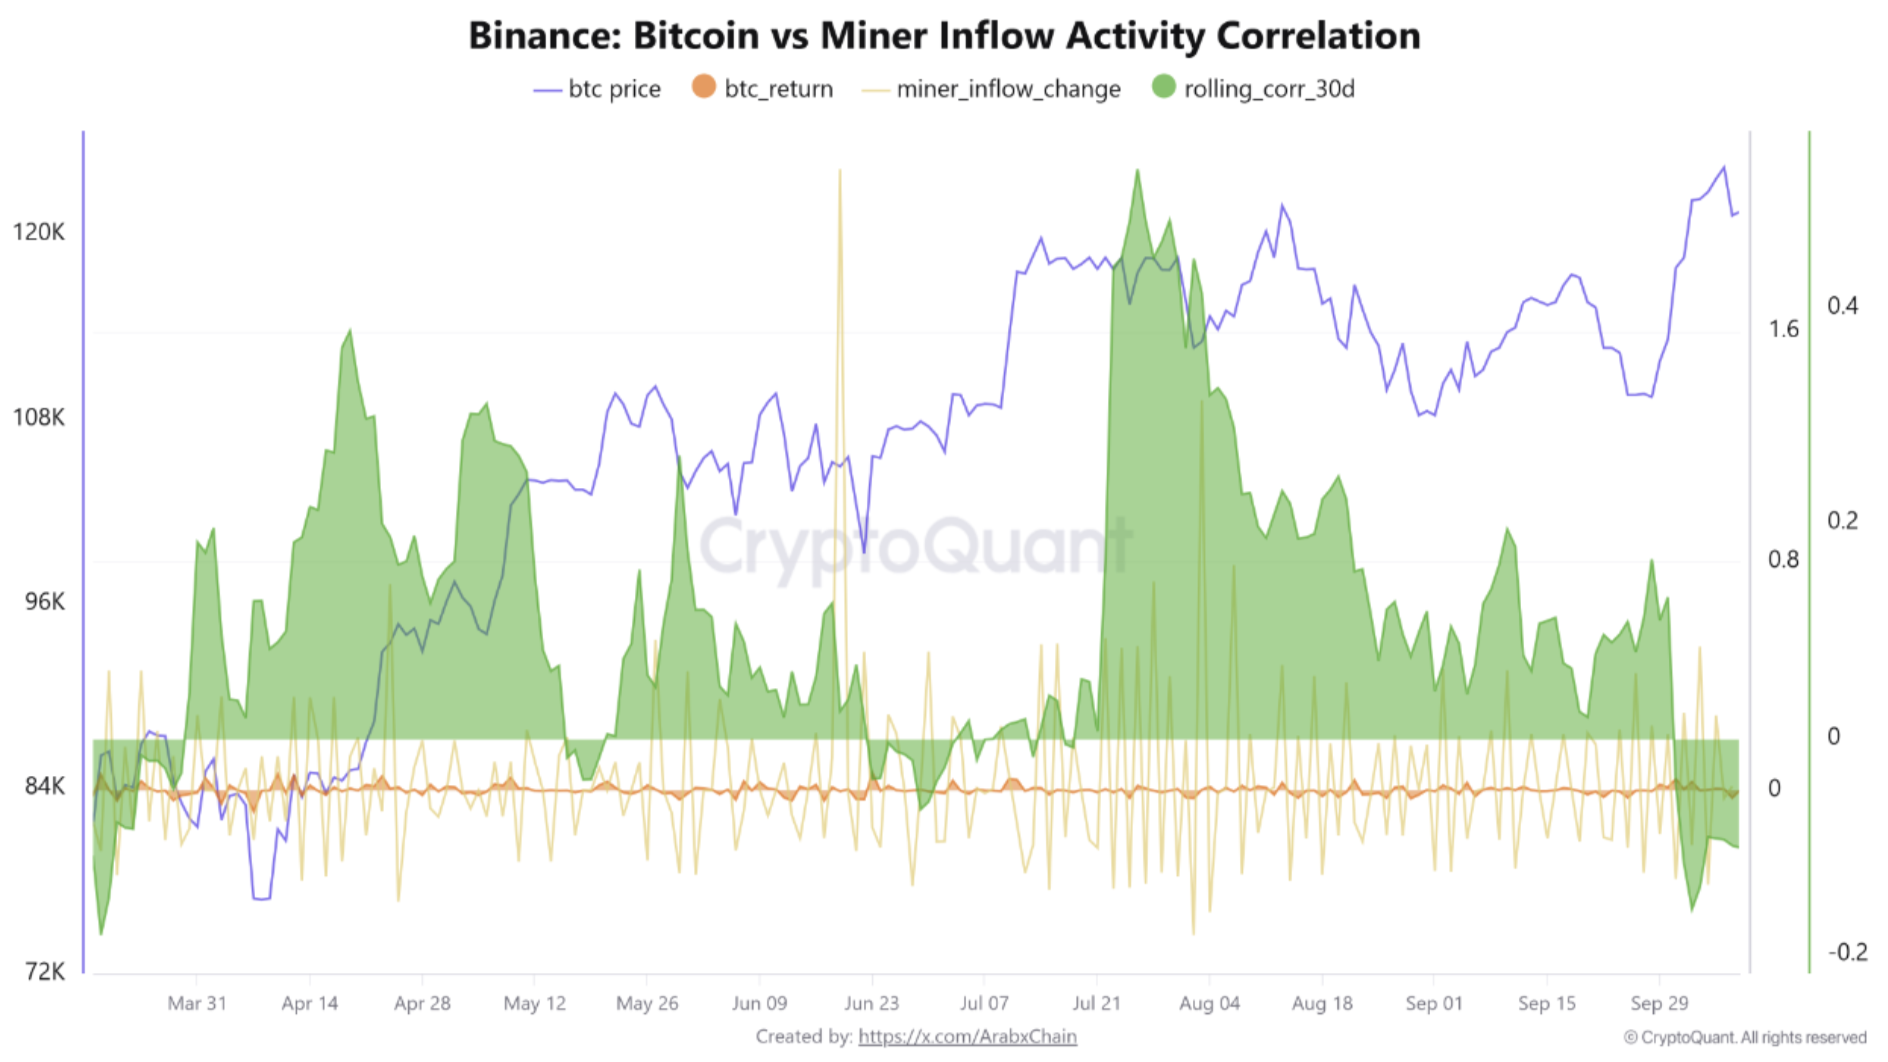
For the uninitiated, the 30-day rolling correlation indicator measures how closely two variables, such as Bitcoin’s price and miner flows, move together over the past 30 days. A positive value means they typically rise or fall in tandem, while a negative value means they move in opposite directions.

It is worth noting that the indicator had previously been moving within a positive range of 0.1 to 0.5 during Q2 2025. The shift from positive rage to negative suggests that the recent surge in BTC price has not been driven by miner flows to exchanges.

This is in stark contrast to previous cycles, where miner flows to exchanges played a key role in BTC’s price movement. However, the current cycle’s positive price action can be attributed to increased demand from investors and institutions. Arab Chain added:

In past cycles, when the price rose, miners often transferred larger amounts of Bitcoin to exchanges to sell and take profits, creating a positive correlation between price and miner flows – meaning that as prices increased, flows also increased.

Arab Chain added that the decline in correlation indicates a phase of “price independence” where miners opt to hold their BTC rather than sell it during times of price appreciation. A fall in miner signal is usually considered a bullish signal, as it reduces BTC’s circulating supply.

That said, if the correlation turns strongly positive again, it could signal the return of selling pressure and a medium-term price correction could be expected. At present, the BTC market is showing a healthy balance between demand and supply.

BTC Needs To Defend This Level

Following BTC’s fall to the low $120,000 range, some crypto analysts say that the top cryptocurrency must defend the $120,600 level to avoid further crash. However, not all analysts are bearish on BTC just yet. 

Related Reading

For instance, crypto entrepreneur Arthur Hayes predicts that US President Donald Trump could send BTC to $250,000 by the end of 2025. At press time, BTC trades at $121,375, down 0.8% in the past 24 hours.

bitcoin
Bitcoin trades at $121,375 on the daily chart | Source: BTCUSDT on TradingView.com

Featured image from Unsplash, charts from CryptoQuant and TradingView.com


Source link

Share. Facebook Twitter Pinterest LinkedIn Tumblr Email
MNK News
  • Website

Related Posts

Ethereum Sees First SuperTrend Bullish Flip In Over A Year

April 22, 2026

XRP Price Bounce Losing Steam, Failure Signals Could Emerge

April 22, 2026

Solana Foundation President Explains Why SOL Is Built For Unified Liquidity

April 22, 2026
Add A Comment
Leave A Reply Cancel Reply

Editors Picks

Gladiators seeking the right team combination: Saud Shakeel

April 22, 2026

Babar was not utilised properly in T20 World Cup: Azhar Mahmood

April 21, 2026

Sri Lanka’s Dasun Shanaka handed one-year PSL ban for IPL switch

April 20, 2026

Late bloomer Salman Mirza sets sights on 2027 World Cup

April 20, 2026
Our Picks

Ethereum Sees First SuperTrend Bullish Flip In Over A Year

April 22, 2026

XRP Price Bounce Losing Steam, Failure Signals Could Emerge

April 22, 2026

Solana Foundation President Explains Why SOL Is Built For Unified Liquidity

April 22, 2026

Recent Posts

  • Ethereum Sees First SuperTrend Bullish Flip In Over A Year
  • XRP Price Bounce Losing Steam, Failure Signals Could Emerge
  • Solana Foundation President Explains Why SOL Is Built For Unified Liquidity
  • Gladiators seeking the right team combination: Saud Shakeel
  • Bitcoin Price Rebound Accelerates, Traders Eye Strong Upside Continuation

Recent Comments

No comments to show.
MNK News
Facebook X (Twitter) Instagram Pinterest Vimeo YouTube
  • Home
  • About US
  • Advertise
  • Contact US
  • DMCA
  • Privacy Policy
  • Terms & Conditions
© 2026 mnknews. Designed by mnknews.

Type above and press Enter to search. Press Esc to cancel.