Close Menu
  • Home
  • AI & Technology
  • Politics
  • Business
  • Cryptocurrency
  • Sports
  • Finance
  • Fitness
  • Gadgets
  • World
  • Marketing

Subscribe to Updates

Subscribe to our newsletter and never miss our latest news

Subscribe my Newsletter for New Posts & tips Let's stay updated!

What's Hot

Fidelity Flags Bitcoin Price Zone That Historically Marked Accumulation

April 30, 2026

More Data Hasn’t Made Women More Certain

April 30, 2026

Sony Says Your PlayStation Won’t Check For Game Licenses Every 30 Days

April 30, 2026
Facebook X (Twitter) Instagram
  • Home
  • About US
  • Advertise
  • Contact US
  • DMCA
  • Privacy Policy
  • Terms & Conditions
Facebook X (Twitter) Instagram
MNK NewsMNK News
  • Home
  • AI & Technology
  • Politics
  • Business
  • Cryptocurrency
  • Sports
  • Finance
  • Fitness
  • Gadgets
  • World
  • Marketing
MNK NewsMNK News
Home » Ethereum Average Daily Outflow Hits 40,000 ETH Amid Rising Buying Pressure
Cryptocurrency

Ethereum Average Daily Outflow Hits 40,000 ETH Amid Rising Buying Pressure

MNK NewsBy MNK NewsAugust 13, 2025No Comments3 Mins Read
Facebook Twitter Pinterest LinkedIn Tumblr Email
Share
Facebook Twitter LinkedIn Pinterest Email


As Ethereum (ETH) trades within striking distance of its all-time high (ATH), on-chain data shows that the second-largest cryptocurrency by market cap is experiencing mounting buying pressure. The asset is currently priced in the $4,600 range, just 4% shy of its ATH.

Ethereum Net Daily Outflows Hit 40,000

According to a CryptoQuant Quicktake post by contributor burakkesmeci, more than 1.2 million ETH have been withdrawn from crypto exchanges over the past month. The analyst suggested that Ethereum’s uptrend is likely to continue.

Related Reading

For context, ETH has surged 53.8% in the last month, underscoring strong buying pressure amid rising institutional adoption. The asset has tripled in price from its local low of around $1,500, recorded in April this year.

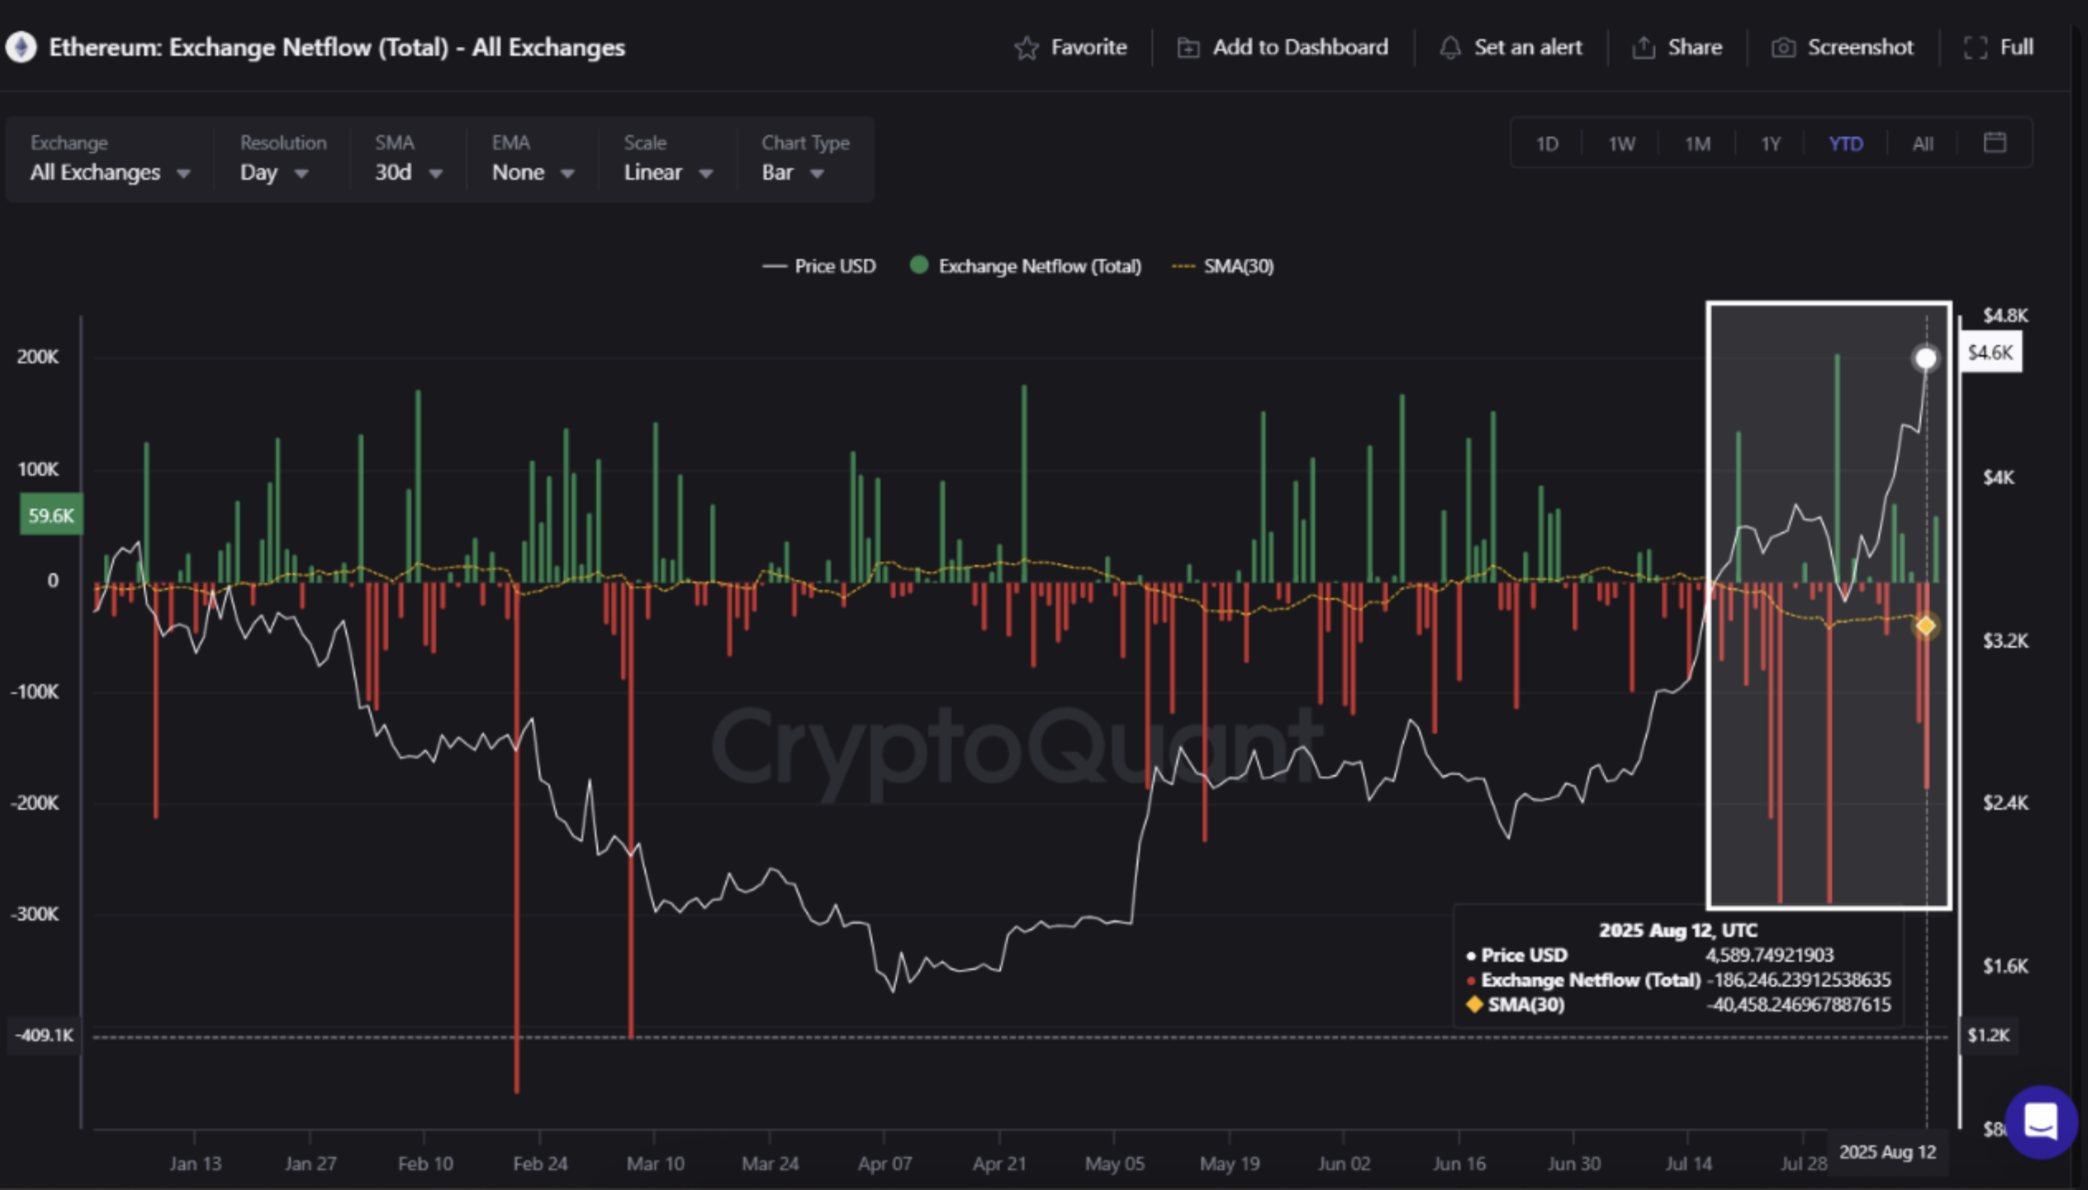
In their analysis, burakkesmeci highlighted Ethereum’s All Exchanges Netflow metric, which tracks the total ETH inflows and outflows across all cryptocurrency exchanges. Data from 2025 shows that Ethereum’s 30-day Simple Moving Average (SMA30) has plunged deep into negative territory.

ethereum
Source: CryptoQuant

For the uninitiated, the SMA30 is the average value of a dataset – such as Ethereum’s daily net flows – calculated over the most recent 30 days. Each day, the oldest data point drops out and the newest is added, creating a smoother trend line that filters out short-term volatility.

As of August 12, Ethereum’s SMA30 stood at -40,000 ETH, indicating an average daily outflow of that amount over the past month. Such large outflows suggest that investors are moving ETH off exchanges – likely into cold storage – in anticipation of further price gains.

The CryptoQuant contributor also pointed to growing activity in spot ETH exchange-traded funds (ETFs). Data from SoSoValue shows that spot ETH ETFs recorded more than $1.5 billion in inflows during the week ending August 12.

Notably, these ETFs have seen uninterrupted positive weekly inflows since May 16, attracting over $8 billion in nearly three months. The total net assets held in ETH ETFs now stand at $27.6 billion, representing 4.7% of Ethereum’s total market capitalization.

ETH Rally To Remain Intact

Burakkesmeci concluded that as long as ETH’s SMA30 remains in negative territory, its uptrend is likely to continue. They noted that unless the metric flips into positive territory, ETH’s bullish momentum could persist in the short term.

Related Reading

Some analysts predict ETH could reach as high as $8,600 if Bitcoin (BTC) surges to $150,000. However, a period of price consolidation is expected after ETH breaks through its current ATH.

Meanwhile, crypto market enthusiast Orbion has advised selling all ETH in October if it reaches between $5,800 and $6,000. At press time, ETH is trading at $4,684, up 6.8% over the past 24 hours.

ethereum
Ethereum trades at $4,684 on the daily chart | Source: ETHUSDT on TradingView.com

Featured image from Unsplash, charts from CryptoQuant and TradingView.com


Source link

Share. Facebook Twitter Pinterest LinkedIn Tumblr Email
MNK News
  • Website

Related Posts

Fidelity Flags Bitcoin Price Zone That Historically Marked Accumulation

April 30, 2026

XRP Price Softens Further, Grinding Losses Test Bullish Patience

April 30, 2026

Bitcoin Price Weakness Grows, Traders Brace For Further Downside

April 29, 2026
Add A Comment
Leave A Reply Cancel Reply

Editors Picks

Usman Khan, Maaz Sadaqat star to take Kingsmen into second Eliminator as Sultans falter

April 30, 2026

Sri Lanka govt 'temporarily' takes over cricket board

April 29, 2026

Babar gifts returning fans century as Zalmi thrash United to make final

April 28, 2026

Inter’s title charge hits bump in road, Milan-Juve clash ends in stalemate

April 27, 2026
Our Picks

Fidelity Flags Bitcoin Price Zone That Historically Marked Accumulation

April 30, 2026

XRP Price Softens Further, Grinding Losses Test Bullish Patience

April 30, 2026

Bitcoin Price Weakness Grows, Traders Brace For Further Downside

April 29, 2026

Recent Posts

  • Fidelity Flags Bitcoin Price Zone That Historically Marked Accumulation
  • More Data Hasn’t Made Women More Certain
  • Sony Says Your PlayStation Won’t Check For Game Licenses Every 30 Days
  • XRP Price Softens Further, Grinding Losses Test Bullish Patience
  • Usman Khan, Maaz Sadaqat star to take Kingsmen into second Eliminator as Sultans falter

Recent Comments

No comments to show.
MNK News
Facebook X (Twitter) Instagram Pinterest Vimeo YouTube
  • Home
  • About US
  • Advertise
  • Contact US
  • DMCA
  • Privacy Policy
  • Terms & Conditions
© 2026 mnknews. Designed by mnknews.

Type above and press Enter to search. Press Esc to cancel.