Close Menu
  • Home
  • AI & Technology
  • Politics
  • Business
  • Cryptocurrency
  • Sports
  • Finance
  • Fitness
  • Gadgets
  • World
  • Marketing

Subscribe to Updates

Subscribe to our newsletter and never miss our latest news

Subscribe my Newsletter for New Posts & tips Let's stay updated!

What's Hot

YouTube’s Picture-In-Picture Mode Is Rolling Out To All Users Worldwide

April 30, 2026

Fidelity Flags Bitcoin Price Zone That Historically Marked Accumulation

April 30, 2026

More Data Hasn’t Made Women More Certain

April 30, 2026
Facebook X (Twitter) Instagram
  • Home
  • About US
  • Advertise
  • Contact US
  • DMCA
  • Privacy Policy
  • Terms & Conditions
Facebook X (Twitter) Instagram
MNK NewsMNK News
  • Home
  • AI & Technology
  • Politics
  • Business
  • Cryptocurrency
  • Sports
  • Finance
  • Fitness
  • Gadgets
  • World
  • Marketing
MNK NewsMNK News
Home » Satoshimeter Shows Where The Bitcoin Price Is In This Cycle
Cryptocurrency

Satoshimeter Shows Where The Bitcoin Price Is In This Cycle

MNK NewsBy MNK NewsAugust 2, 2025No Comments3 Mins Read
Facebook Twitter Pinterest LinkedIn Tumblr Email
Share
Facebook Twitter LinkedIn Pinterest Email


The Bitcoin price surge above $120,000 has reignited speculation about where the flagship cryptocurrency stands in the current cycle. While price action alone offers only part of the picture, on-chain data from the Satoshimeter indicator suggests that Bitcoin is still firmly in the mid-phase of its cycle, pointing to significant potential ahead in its long-term trajectory. 

Bitcoin Price Still In Mid-Cycle Stage

Bitcoin’s climb from $100,000 to a new ATH above $123,000 has brought fresh attention to on-chain metrics used to identify the cryptocurrency’s current stage in the present market cycle. Among them, the Satoshimeter, an indicator developed by crypto analyst Stockmoney Lizard, offers a nuanced look into Bitcoin’s movements and price position. 

Related Reading

According to the expert’s analysis released on X social media, the Satoshimeter signaled that Bitcoin is still far from the euphoric peak zones observed in previous bull markets. Stockmoney Lizard also claimed that Bitcoin’s rally is in its mid-cycle or intermediate phase rather than the final leg of the bull cycle.  

Supporting this analysis, the Satoshimeter employs on-chain metrics to map out Bitcoin’s cyclical behavior, identifying both long-term bottoms and tops. Historically, this indicator’s readings around 1.6 have typically marked major bear market bottoms, as seen in the price chart in the years 2011, 2015, 2019, and 2022. Higher values, on the other hand, previously aligned with cycle peaks and often signaled sharp corrections. 

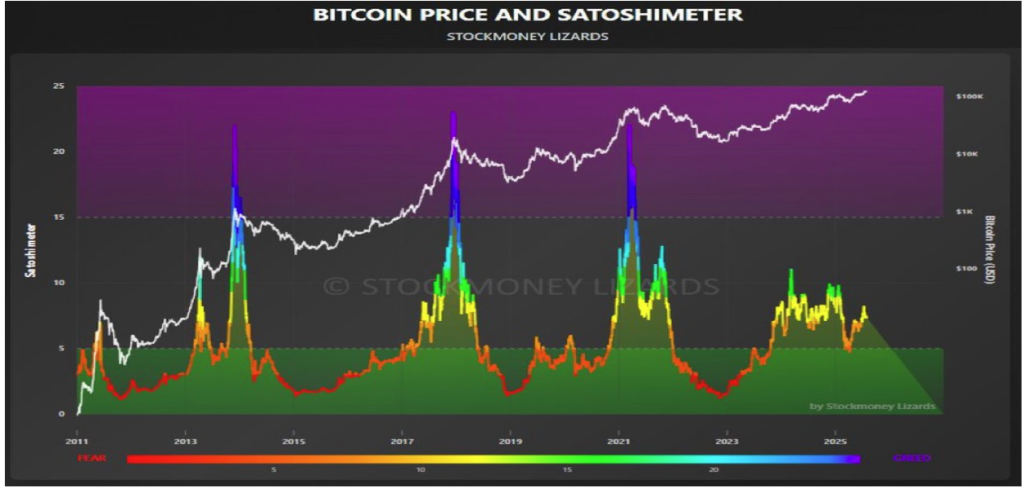
As of now, the Satoshimeter is still well below the upper extremes, signaling that the Bitcoin price is not yet in the overheated zone. The analyst’s chart illustrates this trend clearly. Each past market top is marked by a steep spike in the indicator, aligning with parabolic price action and extreme sentiment.

In contrast, current indicator readings are elevated but stable, sitting in the mid-range, well below levels seen at past cycle tops. This suggests that Bitcoin’s broader bullish structure remains intact, with potential for further upside on the table. 

Bitcoin is currently trading at $113,599. Chart: TradingView

Bitcoin To Reach $200,000 This Cycle?

Based on the Satoshimeter’s current level, Stockmoney Lizards projects an extended run in the Bitcoin price. While the recent jump above $123,000 reflects growing momentum, the analyst anticipates a stair-step progression toward a potential high of $200,000 before a significant market correction sets in.  

Related Reading

This projection is based not only on the readings from the Satoshimeter indicator but also on the movements seen in prior cycles, where BTC typically moved through multiple phases of accumulation, breakout, and parabolic growth. As of writing, the flagship cryptocurrency is trading at $113,759, reflecting an 8.3% decline from its all-time high. With $200,000 set as its next peak target, this implies a potential rally of more than 75% in the current cycle. 

Featured image from Unsplash, chart from TradingView


Source link

Share. Facebook Twitter Pinterest LinkedIn Tumblr Email
MNK News
  • Website

Related Posts

Fidelity Flags Bitcoin Price Zone That Historically Marked Accumulation

April 30, 2026

XRP Price Softens Further, Grinding Losses Test Bullish Patience

April 30, 2026

Bitcoin Price Weakness Grows, Traders Brace For Further Downside

April 29, 2026
Add A Comment
Leave A Reply Cancel Reply

Editors Picks

Usman Khan, Maaz Sadaqat star to take Kingsmen into second Eliminator as Sultans falter

April 30, 2026

Sri Lanka govt 'temporarily' takes over cricket board

April 29, 2026

Babar gifts returning fans century as Zalmi thrash United to make final

April 28, 2026

Inter’s title charge hits bump in road, Milan-Juve clash ends in stalemate

April 27, 2026
Our Picks

Fidelity Flags Bitcoin Price Zone That Historically Marked Accumulation

April 30, 2026

XRP Price Softens Further, Grinding Losses Test Bullish Patience

April 30, 2026

Bitcoin Price Weakness Grows, Traders Brace For Further Downside

April 29, 2026

Recent Posts

  • YouTube’s Picture-In-Picture Mode Is Rolling Out To All Users Worldwide
  • Fidelity Flags Bitcoin Price Zone That Historically Marked Accumulation
  • More Data Hasn’t Made Women More Certain
  • Sony Says Your PlayStation Won’t Check For Game Licenses Every 30 Days
  • XRP Price Softens Further, Grinding Losses Test Bullish Patience

Recent Comments

No comments to show.
MNK News
Facebook X (Twitter) Instagram Pinterest Vimeo YouTube
  • Home
  • About US
  • Advertise
  • Contact US
  • DMCA
  • Privacy Policy
  • Terms & Conditions
© 2026 mnknews. Designed by mnknews.

Type above and press Enter to search. Press Esc to cancel.