Close Menu
  • Home
  • AI & Technology
  • Politics
  • Business
  • Cryptocurrency
  • Sports
  • Finance
  • Fitness
  • Gadgets
  • World
  • Marketing

Subscribe to Updates

Subscribe to our newsletter and never miss our latest news

Subscribe my Newsletter for New Posts & tips Let's stay updated!

What's Hot

Ripple Makes A $13 Trillion Bet With This Move, And XRP Price Could Be Set To Explode

April 6, 2026

Here’s Why The Bitcoin And Ethereum Prices Could Keep Crashing This Week

April 6, 2026

Artemis II arrives in lunar space ahead of its trip around the Moon

April 6, 2026
Facebook X (Twitter) Instagram
  • Home
  • About US
  • Advertise
  • Contact US
  • DMCA
  • Privacy Policy
  • Terms & Conditions
Facebook X (Twitter) Instagram
MNK NewsMNK News
  • Home
  • AI & Technology
  • Politics
  • Business
  • Cryptocurrency
  • Sports
  • Finance
  • Fitness
  • Gadgets
  • World
  • Marketing
MNK NewsMNK News
Home » Bitcoin At Risk? Analyst Says Breaking This Price Level Could Spark Significant Volatility
Cryptocurrency

Bitcoin At Risk? Analyst Says Breaking This Price Level Could Spark Significant Volatility

MNK NewsBy MNK NewsFebruary 14, 2025No Comments3 Mins Read
Facebook Twitter Pinterest LinkedIn Tumblr Email
Share
Facebook Twitter LinkedIn Pinterest Email


Este artículo también está disponible en español.

Bitcoin (BTC) has faced heightened volatility in recent weeks, initially driven by Donald Trump’s proposed trade tariffs and later exacerbated by the latest Consumer Price Index (CPI) data. The inflation report sent BTC plummeting to as low as $94,000 before it managed to recover some losses. However, according to crypto analyst Ali Martinez, Bitcoin must defend a critical price level to avoid a significant correction.

Analyst Identifies Critical Bitcoin Price Level

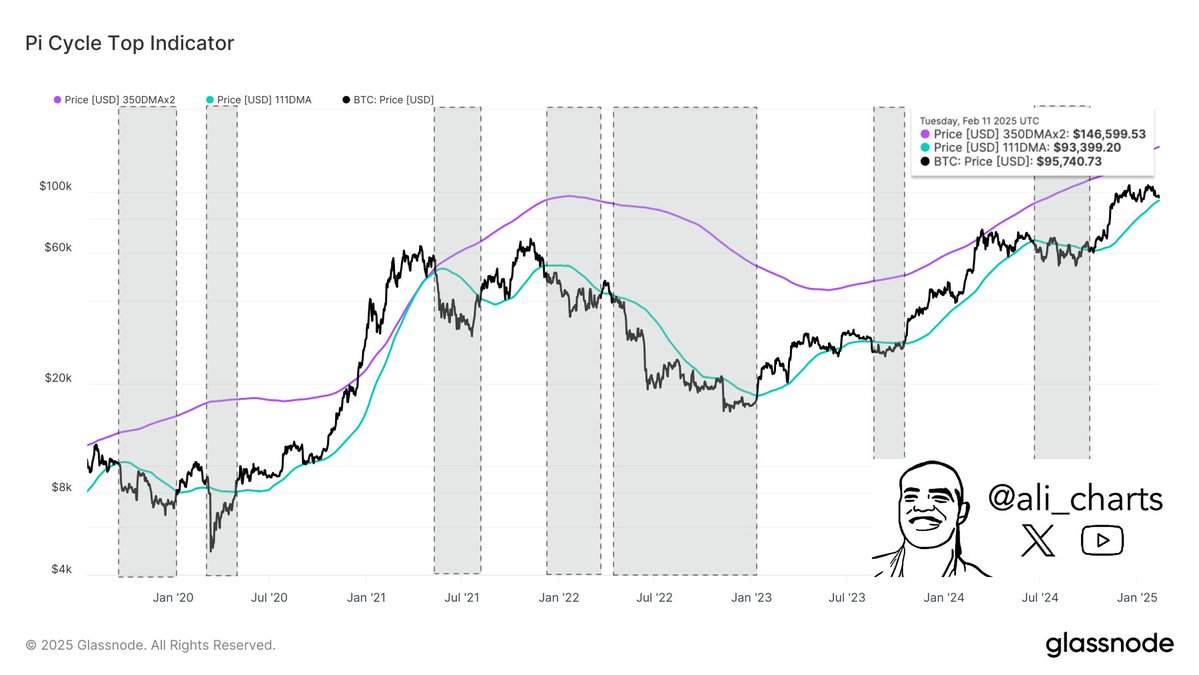
In an X post shared earlier today, Martinez brought attention to the Pi Cycle Top Indicator. For the uninitiated, the Pi Cycle Top Indicator is a Bitcoin market tool that aims to identify market cycle peaks.

Related Reading

The indicator tracks the 111-day moving average (MA) and a multiple – typically 2x – of the 350-day moving average. When the 111-day MA crosses above the 2x 350-day MA, it historically signals a market top.

According to Martinez, Bitcoin tends to experience steep price corrections when it drops below the 111-day MA. Currently, this moving average stands at approximately $93,400. If BTC falls below this level, it could trigger a major downside move.

ali
Source: Ali_charts on X

Fellow crypto analyst Merlijn The Trader shared their thoughts on the current BTC price action. The analyst shared the following chart which shows the similarity between BTC price action in 2021 and 2025.

merlijn
Source: Merlijn The Trader on X

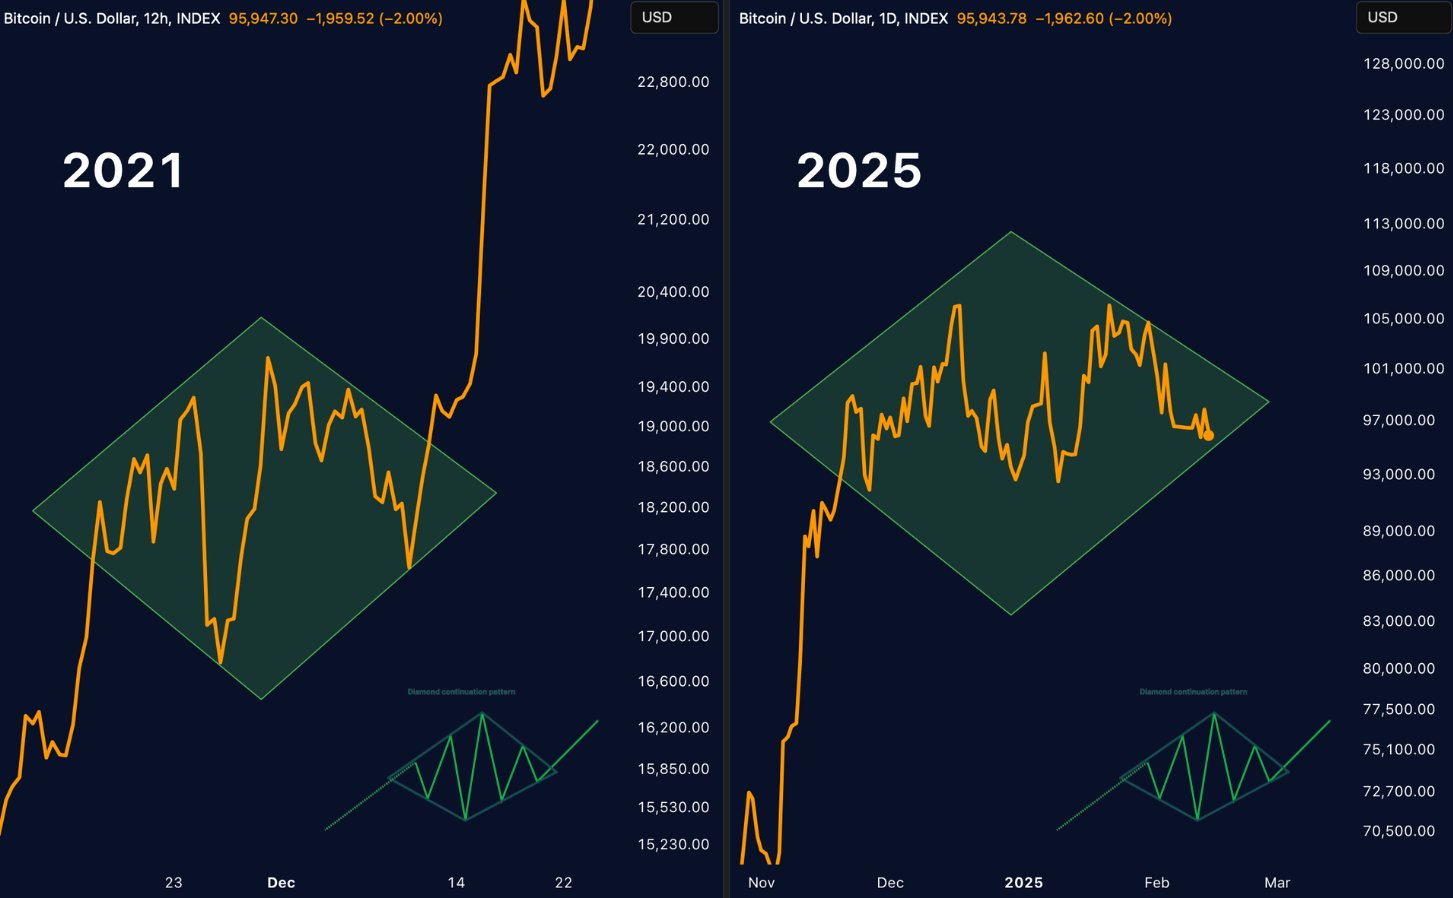
According to the chart, BTC is currently in the midst of completing a bullish diamond pattern. A successful completion of this pattern followed by a bullish breakout may propel BTC to new all-time highs (ATH) beyond $120,000.

Where Is BTC Headed Next?

Crypto investor Daan Crypto Trades also analyzed Bitcoin’s latest price movement, particularly in response to the CPI data. The report confirmed that inflation remains hot in the US, reducing the likelihood of further interest rate cuts from the Federal Reserve (Fed) in the near future. Daan noted:

Most of the liquidity below was taken on the lower time frames. There’s a lot of untapped liquidity sitting higher after all these lower highs the past couple of weeks. If BTC can flip this local downtrend around, those could act as fuel for the move higher.

daan
Source: Daan Crypto Trades on X

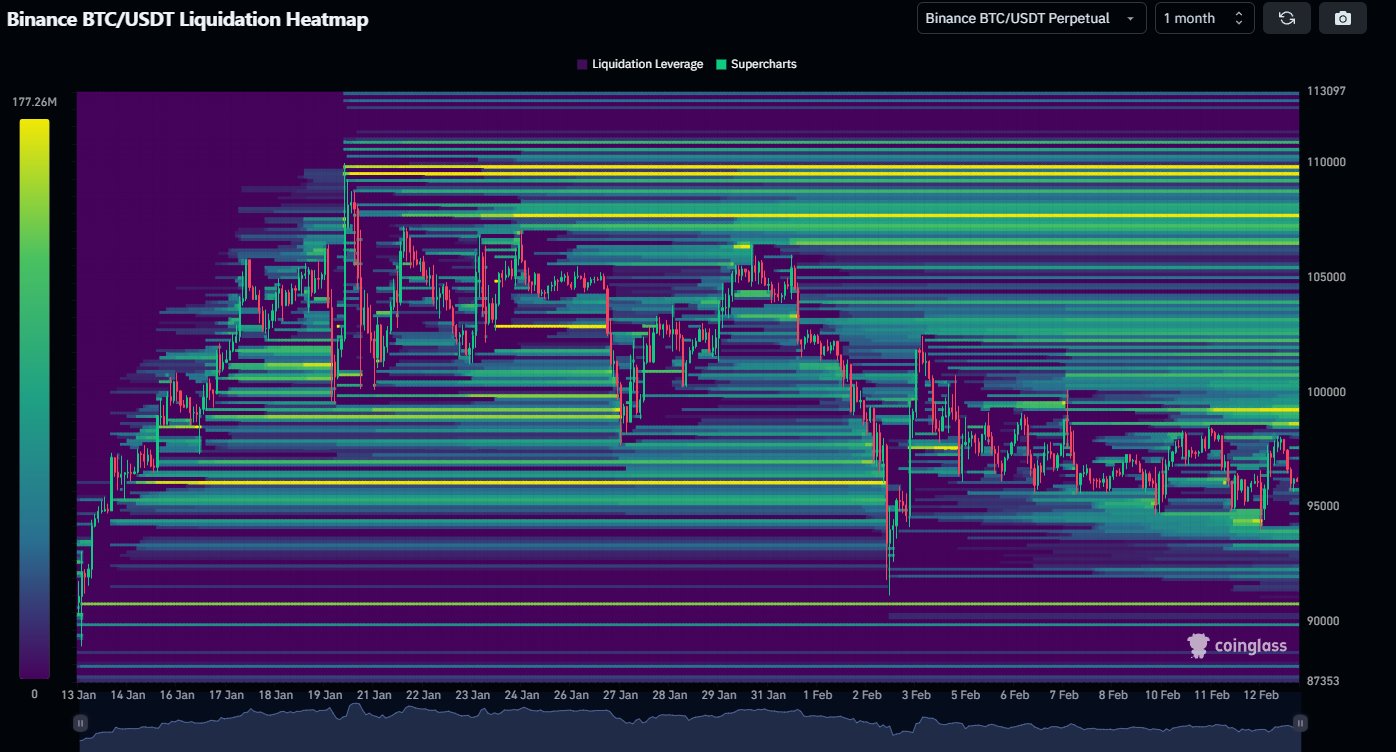
The investor also warned that if BTC slides below $90,000, it could enter a “danger zone.” This level has served as a key support area, with Bitcoin rebounding from it multiple times. A decisive break below it could increase the risk of a larger sell-off.

Related Reading

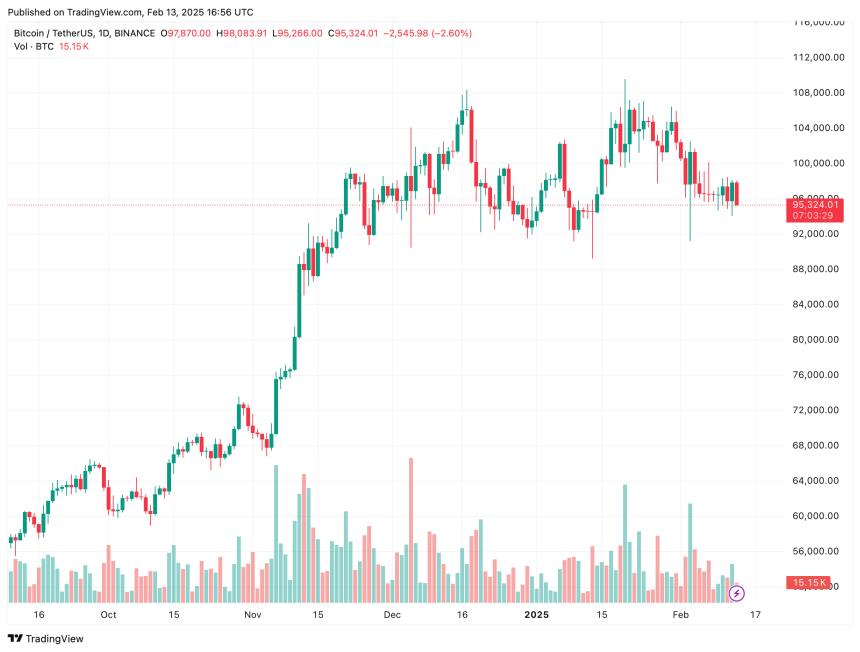
Despite the recent bearish developments, Bitcoin has held firm in the mid-$90,000 range. However, some market participants remain cautious about the possibility of a drop to $80,000 if selling pressure intensifies. At press time, BTC trades at $95,324, down 1% in the past 24 hours.

bitcoin
BTC trades at $95,324 on the daily chart | Source: BTCUSDT on TradingView.com

Featured image from Unsplash, Charts from X and TradingView.com


Source link

Share. Facebook Twitter Pinterest LinkedIn Tumblr Email
MNK News
  • Website

Related Posts

Ripple Makes A $13 Trillion Bet With This Move, And XRP Price Could Be Set To Explode

April 6, 2026

Here’s Why The Bitcoin And Ethereum Prices Could Keep Crashing This Week

April 6, 2026

XRP Price Gains Ground, Traders Question Strength of Rally

April 6, 2026
Add A Comment
Leave A Reply Cancel Reply

Editors Picks

Pogacar clinches joint-record third Tour of Flanders

April 6, 2026

Nawaz spins Sultans to comfortable victory over Gladiators

April 5, 2026

Pegula reaches WTA Charleston Open semi-finals with latest three-setter

April 5, 2026

Rs20 million fine for a deleted tweet: The cost of irreverence?

April 4, 2026
Our Picks

Ripple Makes A $13 Trillion Bet With This Move, And XRP Price Could Be Set To Explode

April 6, 2026

Here’s Why The Bitcoin And Ethereum Prices Could Keep Crashing This Week

April 6, 2026

XRP Price Gains Ground, Traders Question Strength of Rally

April 6, 2026

Recent Posts

  • Ripple Makes A $13 Trillion Bet With This Move, And XRP Price Could Be Set To Explode
  • Here’s Why The Bitcoin And Ethereum Prices Could Keep Crashing This Week
  • Artemis II arrives in lunar space ahead of its trip around the Moon
  • XRP Price Gains Ground, Traders Question Strength of Rally
  • Pogacar clinches joint-record third Tour of Flanders

Recent Comments

No comments to show.
MNK News
Facebook X (Twitter) Instagram Pinterest Vimeo YouTube
  • Home
  • About US
  • Advertise
  • Contact US
  • DMCA
  • Privacy Policy
  • Terms & Conditions
© 2026 mnknews. Designed by mnknews.

Type above and press Enter to search. Press Esc to cancel.