


Este artículo también está disponible en español.
In his latest technical breakdown posted on X, analyst Kevin (@Kev_Capital_TA) highlighted a pivotal threshold on Dogecoin’s daily chart. According to Kevin, reclaiming the $0.28 region on a weekly close—and then showing clear follow-through—could set Dogecoin on a path toward retesting its all-time highs.
He notes: “Get back above the .28 cents level on Dogecoin on a weekly close and show follow through and my thought process is we attack the highs not too long after that. I have been allocating into a spot long at .25 cents on DOGE in the Patreon via the Trading Portfolio (separate from long term bag). Ready for either outcome. Let’s send this thing higher.”
When Will The Dogecoin Correction End?
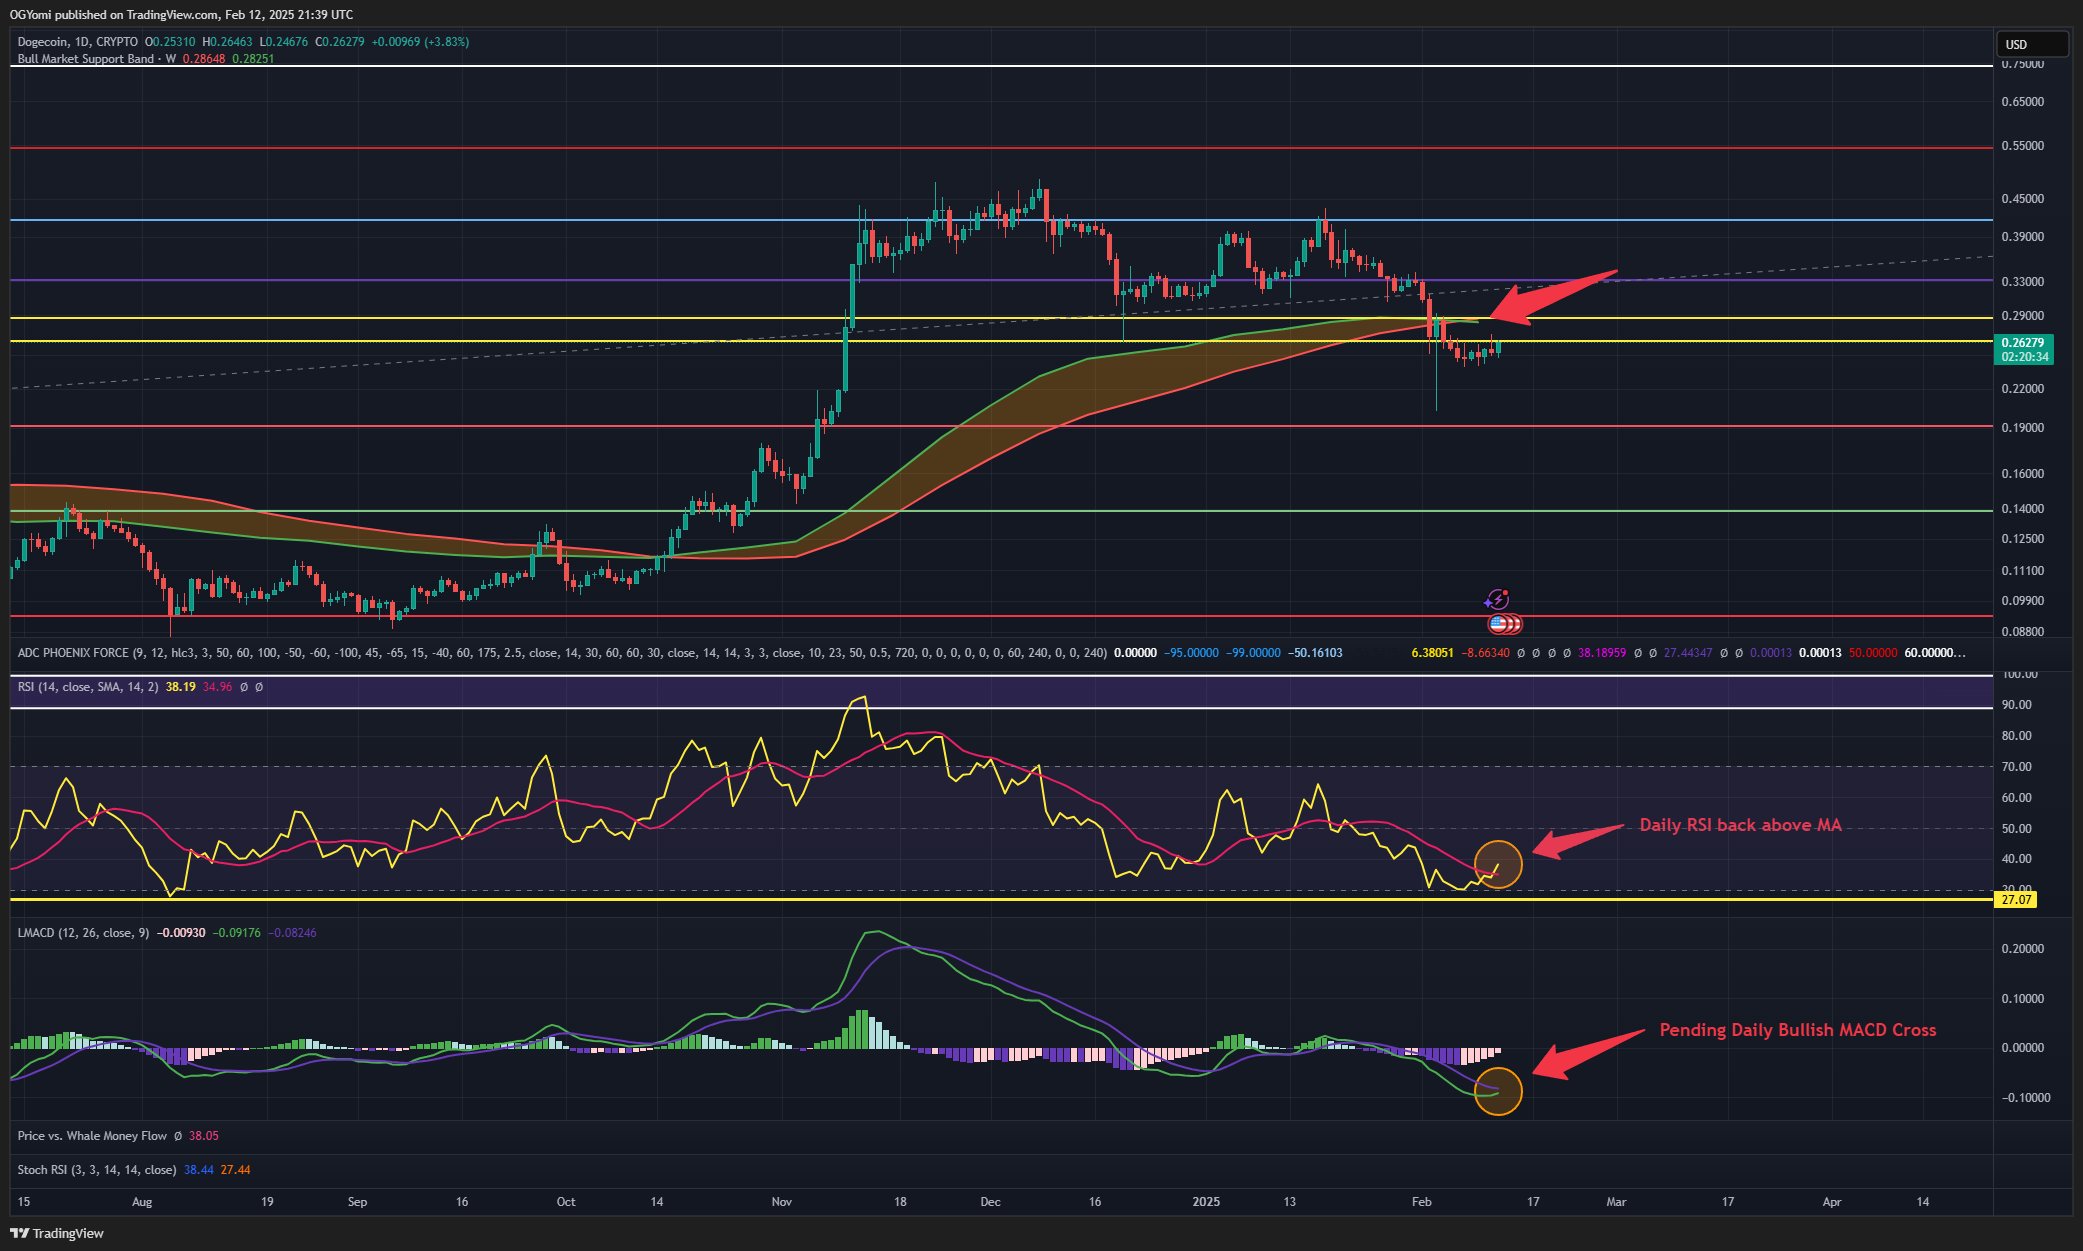
The chart highlights a well-known metric called the Bitcoin Bull Market Support Band, applied here to Dogecoin, which consists of the 20-week Simple Moving Average (SMA) and the 21-week Exponential Moving Average (EMA). Although this indicator was originally developed for Bitcoin, many analysts extend it to altcoins to determine whether the broader trend is bullish or bearish. In Dogecoin’s current setup, this band hovers in the $0.282–$0.286 range. Price dipped below it last week and now facing a key resistance zone between $0.27 and $0.29.
Related Reading
Beyond the price levels, Kevin also points to two momentum studies. On the daily Relative Strength Index (RSI), the yellow line has crossed above its accompanying moving average, suggesting that bearish pressure may be easing. The RSI hovers near 38, which is above a notable support region around 27. Notably, the yellow RSI line is now back above its pink moving average (MA) line. According to Kevin, this may be an early sign of a shift in sentiment if follow-through buying continues.
Another important technical feature is the MACD (Moving Average Convergence Divergence), which is nearing a bullish crossover. The MACD line is approaching the signal line, and if this crossover is confirmed, it could generate positive momentum for Dogecoin. Kevin marks this as a “Pending Daily Bullish MACD Cross,” which, if validated, would add further credence to the bullish outlook.
Related Reading
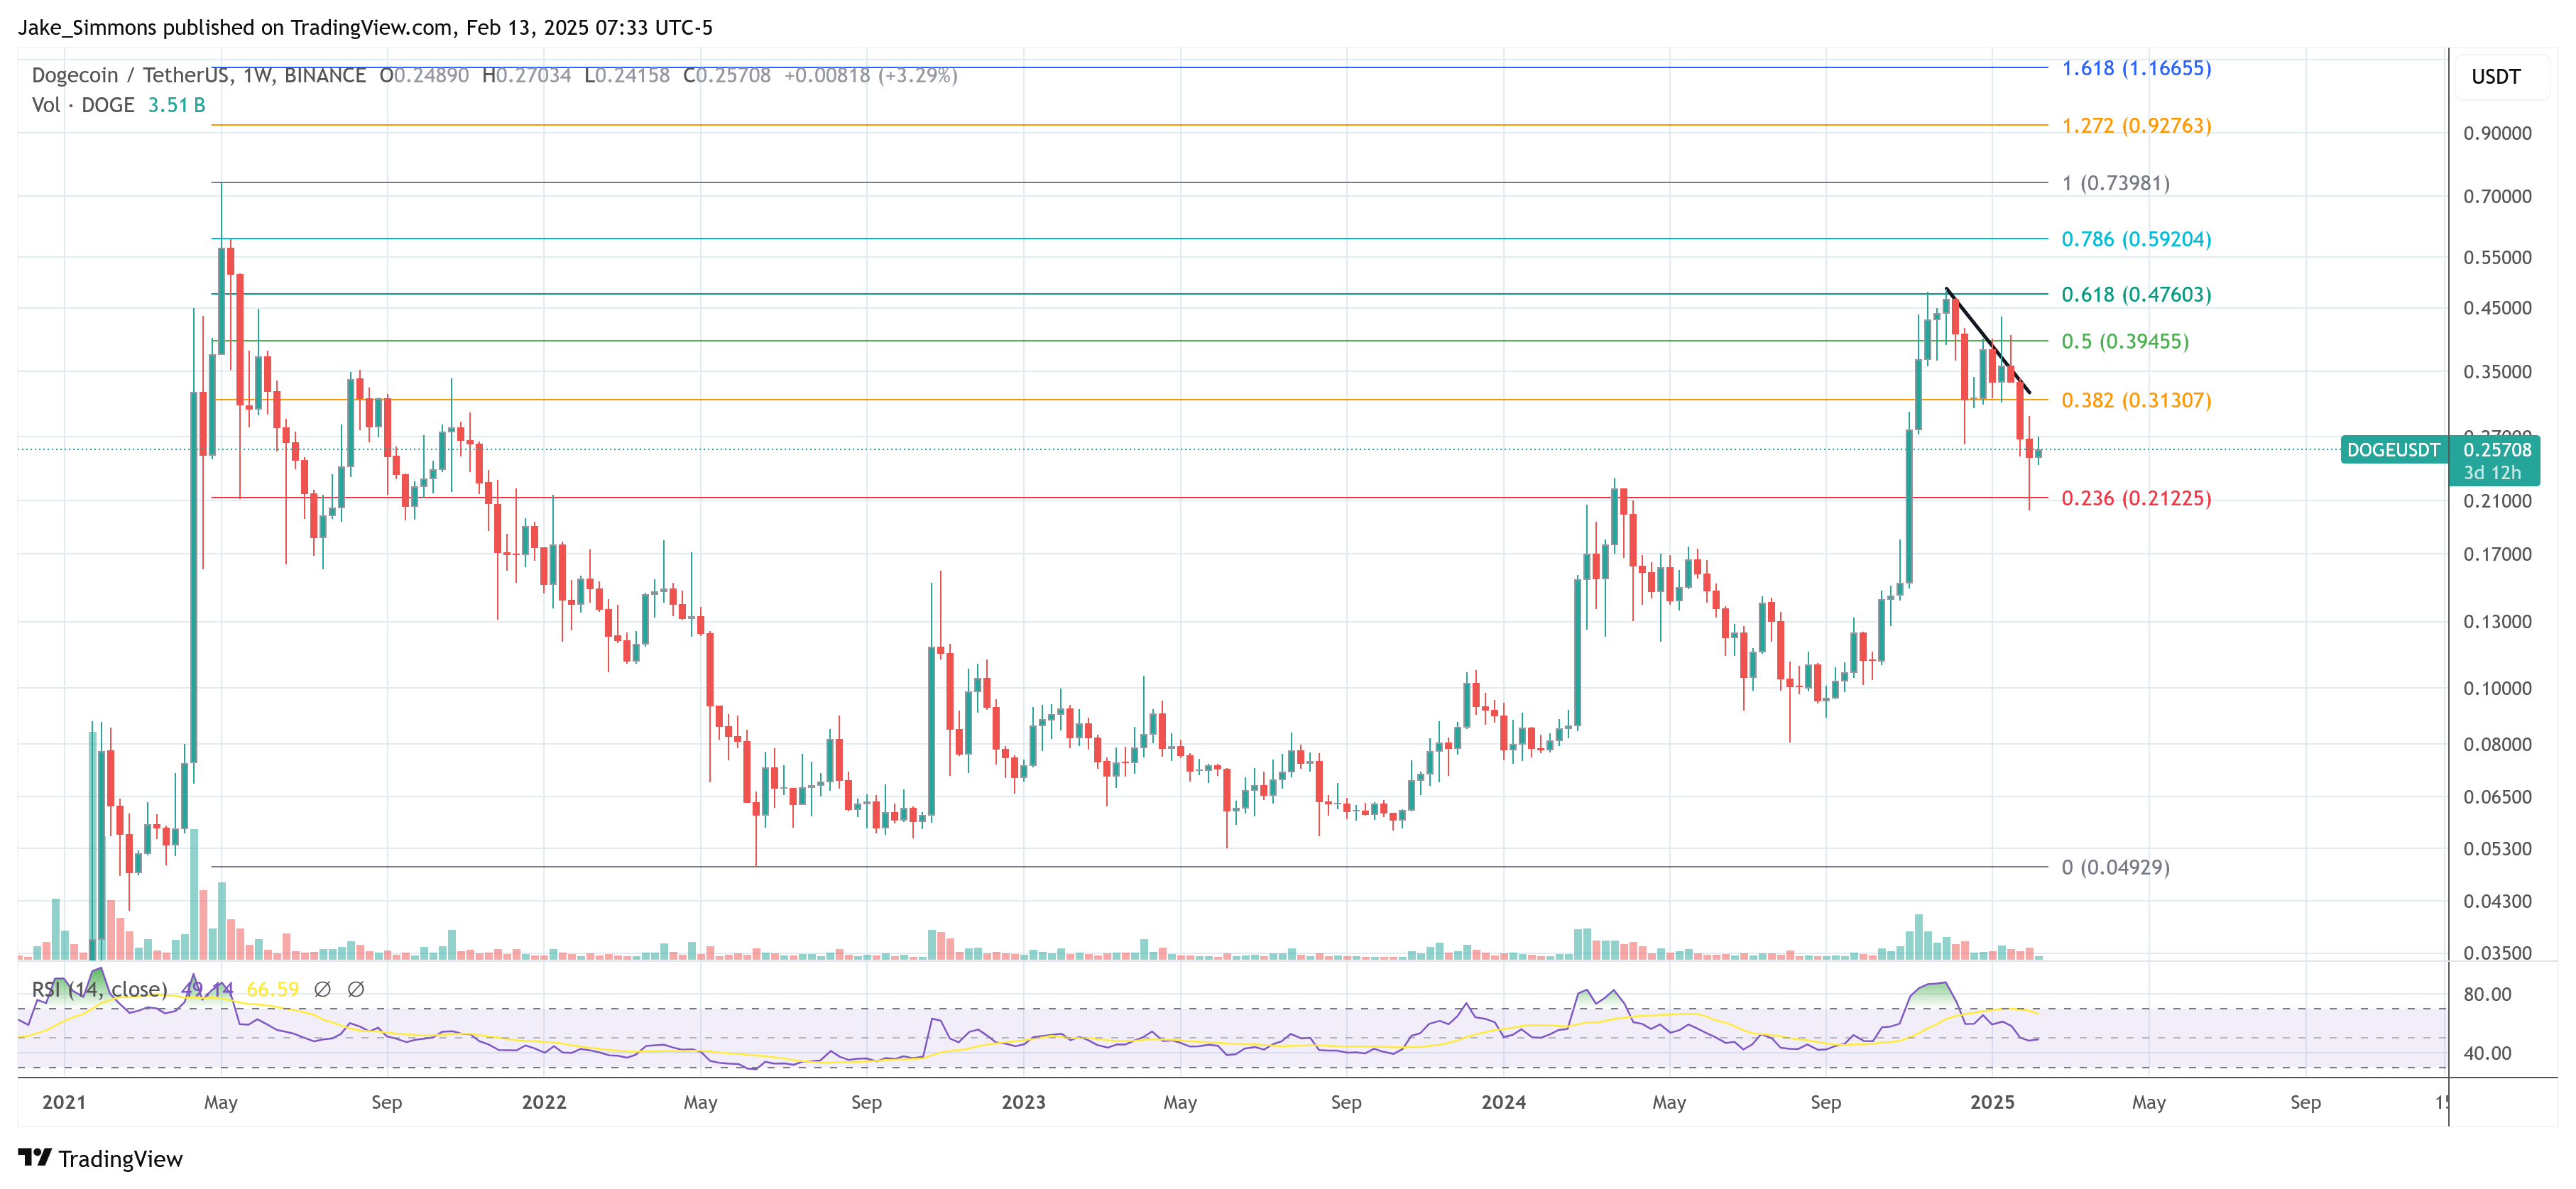
In the larger scheme, the chart underscores that a firm weekly close above $0.28 is the key catalyst. This level aligns with the Bull Market Support Band, and if reclaimed decisively, could accelerate Dogecoin’s push toward mid-$0.30s or beyond, provided broader market conditions remain conducive.
In another post, Kevin explained: “I have been saying it for weeks now while the rest have said its altseason. We are in a major correctional period. These periods happen in markets in case you never noticed. Crypto is very driven off the macro, especially altcoins. We want to hold these levels on Total Market Cap if we want to feel good about this market otherwise the correction can go deeper. In the mean time Chill out. Still billions in liquidity up to $111K on BTC that will be taken eventually.”
At press time, DOGE traded at $0.25.
Featured image created with DALL.E, chart from TradingView.com